DEI metrics are the specific data points you use to track and measure how you’re actually doing on diversity, equity, and inclusion. Think of them less as a simple headcount and more as a sophisticated diagnostic tool. They reveal the true health of your workplace culture, highlighting both your strengths and, more importantly, your hidden challenges.
These metrics provide objective insights into representation, fairness, and belonging across the entire employee journey—from the first application to the exit interview.
Why DEI Metrics Are Your Most Powerful Strategic Tool?
Imagine your organisation as a complex, high-performance engine. A basic headcount tells you the engine is running, sure. But it won’t tell you anything about fuel efficiency, component wear, or underlying stress fractures that could lead to a total breakdown.
Strategic DEI metrics are the advanced diagnostics that reveal this deeper story. They give you a real-time look at your company’s true health, efficiency, and potential for growth. Moving beyond surface-level diversity ratios allows you to diagnose the hidden cultural barriers causing friction and holding you back.
For example, a healthy hiring diversity rate means very little if promotion rates for underrepresented groups lag significantly behind. This is the point where DEI metrics stop being a simple reporting task and become a powerful strategic lever for Chief Human Resources Officers (CHROs).
Moving from Reporting to Strategy
The real power of DEI metrics is unlocked when they start informing your business decisions. They provide a clear, data-informed narrative that connects your people-focused initiatives directly to business outcomes.
A strong DEI strategy, backed by solid metrics, can help you:
- Predict Retention Risks: High turnover within a specific demographic is a massive red flag. Metrics help you spot these trends early and step in before you lose valuable talent.
- Fuel Innovation: It’s proven that diverse teams consistently outperform homogeneous ones. Metrics can show you exactly where you need to build more diverse perspectives to drive creativity and better problem-solving.
- Strengthen Employer Branding: In today’s competitive talent market, a demonstrated commitment to DEI is a major differentiator. To learn more, check out our guide on the role of diversity and inclusion in employer branding.
By treating DEI metrics with the same rigour as financial reports, you transform them from a compliance checkbox into a predictive tool for organisational success. Just as a CFO uses profit margins and ROI to guide financial strategy, a CHRO uses DEI data to build a resilient, high-performing workforce.
Analysing the Full Employee Lifecycle
A truly effective approach demands analysing the entire employee lifecycle. It’s not enough to just look at who you hire. To get actionable insights, you have to examine the complete journey.
This means tracking metrics from the very first touchpoint to an employee’s eventual departure. This holistic view is what connects disparate data points into a cohesive story.
Are you attracting a diverse pool of candidates only to lose them during the interview process? Are new hires from underrepresented backgrounds receiving the same mentorship opportunities as their peers? Answering these questions with data is what turns measurement into a meaningful, sustainable strategy that drives real change.
A Practical Framework for Understanding DEI Metrics
To really get a handle on DEI metrics, you need to think beyond a random list of data points. The key is organising them into a clear, logical framework.
Think of it like a business scorecard. You wouldn’t just glance at revenue and call it a day, would you? Of course not. You’d dig into profit margins, operational costs, and customer lifetime value to get the complete picture. DEI metrics work the same way, falling into three core pillars that, when combined, tell the full story of your organisation’s health.
These pillars help you answer three make-or-break questions:
- Diversity: Who makes up our team right now?
- Equity: Are our systems and processes genuinely fair for everyone?
- Inclusion: How do our people actually feel about working here?
Using data to answer these questions forces a balanced approach. It stops you from making the classic mistake of acing one area while completely dropping the ball on the others. For example, hitting your diversity hiring targets is a fantastic start, but that win quickly turns into a loss if equity issues push those same talented people out the door within a year.
The First Pillar: Diversity
Diversity metrics are the most straightforward of the three. They give you a clean, quantitative snapshot of your workforce’s composition—the “what” of your DEI strategy. These metrics are all about measuring representation across different demographic groups.
A few key diversity metrics to watch are:
- Workforce Representation: The percentage of employees from various backgrounds (like gender, region, disability, or ethnicity) at every single level of the company.
- Hiring Diversity: A simple comparison of the demographic makeup of your new hires versus your entire applicant pool.
- Leadership Diversity: This one’s critical. It’s the representation of diverse groups in your management and executive ranks, and it’s a powerful signal of whether upward mobility is a reality for everyone.
These numbers give you a starting line. They tell you exactly where you stand today, which is the only way to set realistic, measurable goals for where you want to go.
The Second Pillar: Equity
Equity is all about fairness. While diversity asks who is in the room, equity drills down into whether everyone in that room has a fair shot at succeeding. Equity metrics are like diagnostic tools for your internal systems—your processes for pay, promotions, and performance reviews.
Equity metrics are the system diagnostics for your organisation. They move beyond counting people to evaluating the fairness of the processes that impact their careers, ensuring the path to success is accessible to everyone, not just a select few.
Important equity metrics you should be tracking include:
- Pay Equity: This involves analysing compensation data to spot and fix any pay gaps between different demographic groups who are doing similar work. A proper pay gap analysis is non-negotiable for any serious DEI strategy.
- Promotion Rate Parity: Here, you’re comparing the rates at which employees from different groups are promoted. Big differences can be a red flag for unconscious bias in performance reviews or a lack of equal opportunities.
- Performance Review Equity: This means digging into performance scores across demographics to make sure your evaluation process is free from bias.
This diagram shows how these metrics fit into the bigger picture of your company’s overall health.
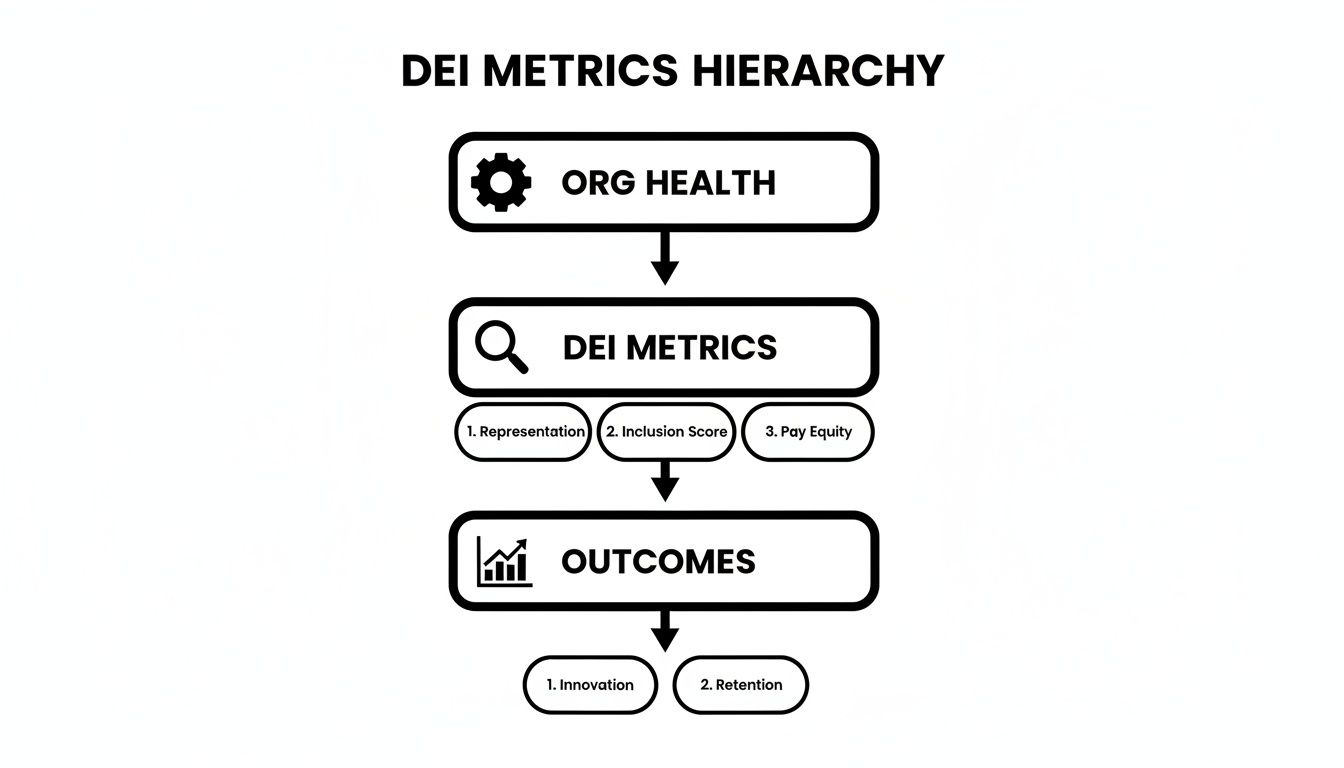
As you can see, strong DEI metrics act as the bridge between general organisational wellbeing and hitting major business goals like growth and innovation.
The Third Pillar: Inclusion
Inclusion is arguably the toughest pillar to measure because it’s about feelings and personal experiences. It gets to the heart of the matter: “Do our employees feel like they truly belong here?” While diversity gets people in the door and equity ensures they’re treated fairly, inclusion is the magic ingredient that makes them want to stay.
Measuring inclusion often means gathering qualitative data to capture how your employees are feeling.
- Belonging Scores: Usually collected through anonymous engagement surveys, these scores tell you whether employees feel valued, respected, and psychologically safe at work.
- Participation in Employee Resource Groups (ERGs): When employees are actively engaged in ERGs, it can be a strong sign of an inclusive culture where people feel seen and supported.
- Retention Rates by Demographic: While this is a retention metric on the surface, high turnover among specific groups is often a direct symptom of a non-inclusive environment.
To give you a clearer picture of how these pillars and their corresponding metrics play out across an employee’s journey with your company, here’s a helpful table.
The Three Pillars of DEI Metrics Across the Employee Lifecycle
| DEI Pillar | Recruitment Metrics | Development Metrics | Retention Metrics |
|---|---|---|---|
| Diversity | Applicant pool demographics, hiring diversity rate, leadership representation | Representation in high-potential programs, diversity in mentorship pairings | Workforce representation at all levels, diversity of voluntary leavers |
| Equity | Offer acceptance rates by demographic, pay at hire analysis | Promotion rates by demographic, performance review score distribution | Pay equity gap analysis, exit interview feedback on fairness |
| Inclusion | Employer brand perception among diverse groups | Participation in ERGs, inclusion survey scores by team/demographic | Retention/turnover rates by demographic, belonging survey scores |
This table helps connect the dots, mapping specific data points to the bigger-picture goals of diversity, equity, and inclusion at each stage.
Tracking these three pillars gives you a holistic, 360-degree view. It helps you see the direct line between your hiring efforts and the long-term success and satisfaction of your employees. For an even deeper dive into the numbers that fuel successful hiring, check out our comprehensive guide on key talent acquisition metrics. Ultimately, this framework ensures your DEI strategy is built on the complete employee experience, turning measurement from a simple reporting task into a powerful tool for real change.
Building an Actionable DEI Dashboard for Your Leadership Team
Raw data is just a collection of numbers. To actually drive change, you need to weave those numbers into a story that grabs your leadership team’s attention. This is where a DEI dashboard shines—it’s not just another spreadsheet, but a strategic tool that visualises progress, flags challenges, and steers smart decisions.
A truly effective dashboard does more than just report figures. It connects the dots, showing how your recruitment efforts influence promotion rates, or how inclusion scores directly impact retention. It answers the crucial “so what?” question before anyone even has to ask.

This simple shift transforms abstract DEI metrics into tangible business intelligence, making it far easier to get the buy-in and resources you need for your most important initiatives.
Selecting Your Core Dashboard Metrics
The key is to avoid analysis paralysis. Instead of throwing every possible metric at your audience, focus on a curated set of 10-12 essential indicators. Each one should tell a specific part of your DEI story, from who you’re attracting to who is succeeding long-term.
Here are some of the most powerful DEI metrics to build your dashboard around:
- Candidate Pipeline Diversity vs. Hire Diversity: This is a classic for a reason. It quickly shows you if there are drop-off points or potential biases sneaking into your interview and selection process.
- Representation by Level and Department: A must-have metric. It tells you if diversity is spread evenly across the organisation or if it’s clustered only in junior roles.
- Promotion Velocity by Demographic Group: This measures how quickly different groups of employees are moving up the ladder, spotlighting potential gaps in development and opportunity.
- Pay Gap Analysis: An essential for equity. This metric puts a hard number on any compensation disparities between different demographic groups in similar roles.
- Inclusion Sentiment Score: Pulled straight from engagement surveys, this gives you a direct pulse on whether your employees genuinely feel like they belong and are valued.
- Voluntary Turnover Rate by Demographic: If you see high turnover within a specific group, that’s a massive red flag. It points to underlying inclusion or equity issues that need fixing, fast.
Each of these data points offers a unique lens on your progress. Together, they paint a comprehensive and brutally honest picture of where your organisation stands.
Turning Data Into Actionable Insights
Once you’ve picked your metrics, the real work begins: making them easy to understand and act on. This is all about smart calculations and strategic segmentation to dig into the root causes of any challenges you uncover.
A great example is the promotion parity ratio. It’s a simple but incredibly powerful way to measure equity. Just divide the promotion rate of an underrepresented group by the promotion rate of a majority group. A ratio below 1.0 signals a potential disparity that needs a closer look.
Segmentation is your most powerful analytical tool. Drilling down into your DEI metrics by department, seniority level, and geographic location is what turns broad observations into specific, solvable problems.
For instance, a company-wide pay gap might actually be driven by a single department. Or those low inclusion scores could be concentrated within a specific layer of management. Without segmentation, you’re just guessing. This level of detail allows your RPO partner or internal team to design targeted fixes instead of wasting time on generic, one-size-fits-all solutions. For more inspiration, take a look at our collection of effective HR dashboard examples.
Designing for Clarity and Impact
Let’s be honest: how your dashboard looks is just as important as the data it holds. The goal is to present complex information so that anyone can understand it at a glance. Your analytics team needs to prioritise clarity, using visuals that tell a clear, compelling story.
Think about using these chart types to really make an impact:
- Pipeline Funnels: Perfect for showing candidate drop-off rates at each stage of the hiring process. You can see exactly where diverse talent might be exiting.
- Representation Trend Lines: Use simple line graphs to track your workforce diversity over time (quarterly or annually) to show progress against goals.
- Heat Maps: These are brilliant for displaying segmented data, like inclusion scores across different departments or locations, making it easy to spot hotspots.
This visual approach is especially critical in fast-moving sectors. In India, for example, Global Capability Centres (GCCs) have seen a massive 33% year-on-year increase in diversity recruitment. This trend makes tracking these metrics more vital than ever for a competitive talent strategy. To dig deeper, you can read more on how data-driven DEI is driving inclusive leadership and see why these analytics are becoming non-negotiable.
By presenting your DEI data in a clear, compelling dashboard, you give your leadership the insights they need to make the right strategic calls.
Common Pitfalls in DEI Measurement and How to Avoid Them
Kicking off a data-driven DEI journey is a fantastic move, but it’s not always a smooth ride. Even the most carefully planned strategies can hit common roadblocks that weaken credibility and bring progress to a grinding halt. Knowing what these traps look like is the first step to building a measurement framework that actually works.
To get it right, you need to be on the lookout for misleading data, disconnected systems, and analysis that only scratches the surface. By spotting these issues early, you can make sure your DEI metrics lay the groundwork for real change, not just a glossy report.
The Allure of Vanity Metrics
One of the easiest mistakes to make is getting caught up in vanity metrics. These are numbers that look great on a presentation slide but don’t tell you anything meaningful about what’s happening in your organisation. They often paint a rosy picture while hiding the real problems brewing underneath.
A classic example is celebrating high diversity numbers in your entry-level hiring without looking at who actually gets promoted. This is a huge issue in many industries. For instance, the Indian IT sector often boasts impressive female representation at the recruitment stage, with some firms reporting a 51% female intake. But that number plummets when you look at leadership roles, exposing a huge gap in career progression and equity. This demographic cliff is a persistent problem, especially when only 15% of boards have set up clear accountability for gender diversity metrics. You can dig deeper into this measurement and governance gap to see the full picture.
A vanity metric tells you what looks good. A strategic metric tells you what is actually working. The goal is to stop celebrating activity and start measuring real impact on equity and inclusion across the entire employee lifecycle.
To steer clear of this trap, your DEI metrics have to be tied to real business outcomes. Don’t just track the diversity of new hires; set ambitious goals for representation in your leadership pipelines and measure how quickly different demographic groups are getting promoted.
Overcoming Data Silos
Another major hurdle is dealing with data silos. This is what happens when crucial information is stuck in different systems that don’t talk to each other. Your Applicant Tracking System (ATS) has the recruitment data, your Human Resources Information System (HRIS) has promotion and pay data, and your engagement surveys hold all the valuable feedback from your team.
When these systems are islands, you can’t see the whole story. You might be celebrating a diverse hiring class (a metric from your ATS) without realising that a huge chunk of those new hires are leaving within 18 months because the culture isn’t inclusive (a story your HRIS and survey data would tell).
The solution? Integration. By connecting your key HR tech platforms, you can follow the entire employee journey from start to finish. This lets you answer the questions that really matter:
- Are candidates from certain backgrounds dropping out at a specific interview stage?
- Is there a link between low belonging scores and high turnover in a particular department?
- Are promotions being awarded fairly when you look at performance review data?
Breaking down these silos turns isolated numbers into a clear story, showing you the root causes of your DEI challenges.
Ignoring the Power of Intersectionality
Finally, a simplistic approach to DEI metrics often misses the concept of intersectionality. This is just the understanding that people have multiple, overlapping identities—like gender, race, disability, and sexual orientation—that combine to create unique experiences.
Looking at your data through just one lens, like gender, can hide major disparities. For example, the workplace experience of a woman with a disability might be completely different from that of an able-bodied woman. If you only analyse your data by gender, you miss that critical nuance entirely.
To build a strategy that’s truly inclusive, you have to analyse your data from multiple angles. Don’t just segment your metrics by one category; look at the intersection of two or more. This deeper dive will uncover the complex, layered challenges within your organisation and help you create targeted, effective support for everyone on your team.
The Future of DEI Metrics and Emerging Technology
The way we measure DEI is hitting a turning point. We’re moving away from static, backward-looking reports and into a more dynamic, predictive, and genuinely human-centred space. As organisations plan for the future, the technology they lean on and the metrics they track are shifting to paint a much richer picture of the employee experience.
Emerging technologies are really driving this change. Artificial intelligence (AI) isn’t some far-off concept anymore; it’s a practical tool for building fairer systems right now. AI-powered platforms can scan thousands of job descriptions in moments, flagging subtle, gender-coded language or biased phrasing that could unknowingly put off diverse candidates.
Predictive analytics is another game-changer. These platforms dig into historical data on hiring, promotions, and turnover to forecast what your organisation’s diversity will look like down the line. This lets CHROs shift from being reactive to proactive, spotting potential blockages in the talent pipeline long before they turn into major problems.
Moving Beyond Western Frameworks
One of the biggest shifts, especially in the Indian context, is the move away from generic, one-size-fits-all DEI frameworks. Let’s face it, standard Western metrics often completely miss the unique socio-cultural and economic realities that shape an employee’s life in India. The most forward-thinking companies are now building more nuanced DEI metrics that reflect this local complexity.
This means digging deeper than just representation numbers. We need to measure the things that actually enable or block someone from participating fully in the workforce. These next-generation metrics include:
- Infrastructure Accessibility: Are we tracking access to vital support like safe transport for employees on late shifts? What about on-site or subsidised childcare, or robust mental health support? These are real-world barriers.
- Neurodiversity Inclusion: It’s time to move past just physical disability and start measuring how effective our support is for neurodivergent employees—those with autism, ADHD, or dyslexia.
- Regional and Linguistic Diversity: In a country as diverse as India, are we measuring representation from different states and linguistic backgrounds? A truly pan-Indian workforce is a massive advantage for market relevance and innovation.
This localised approach is picking up speed, thanks to a growing ecosystem of specialised tech. India’s own diversity tech startup scene is creating a huge shift in how DEI is measured and actioned, with platforms offering bias detection and hiring solutions designed for the Indian context. This is a crucial development, acknowledging that generic tools often overlook critical gaps, like the need to measure infrastructure access, which remains a massive blind spot despite its importance.
You can explore more on this topic in our article on the future of diversity hiring in India on acarasolutions.in.
Integrating Quantitative and Qualitative Data
The future of DEI metrics isn’t just about better tech; it’s about blending hard numbers with the human experience. While quantitative data tells you what is happening, it’s the qualitative data that explains why.
The most advanced DEI strategies will treat sentiment as a core business metric. Understanding how employees feel is just as important as knowing your turnover rate, because one is often a leading indicator of the other.
This is where technologies like sentiment analysis step in. By analysing anonymised text from engagement surveys, internal chat channels, and exit interviews, these tools can spot recurring themes and give you a real pulse on the mood of your workforce.
Imagine combining a Pay Equity Ratio (quantitative) with sentiment analysis on fairness in pay (qualitative). The insight you get is far more powerful than either metric on its own. This integrated approach doesn’t just prepare you to meet employee and stakeholder expectations—it prepares you to exceed them, future-proofing your DEI strategy for years to come.
Turning Your DEI Metrics Into Meaningful Action
Let’s be honest: collecting data is the easy part. The real work begins when you use those DEI metrics to spark genuine, meaningful change across your organisation. Data sitting on a dashboard is just a collection of numbers. But data that actually informs your strategy? That becomes a powerful engine for progress. The final, most critical step is turning those carefully gathered insights into a clear, actionable roadmap.
This leap from measurement to movement doesn’t happen by chance. It demands a structured, deliberate plan that gets leaders on board, empowers managers, and builds trust with every single employee. Think of it like moving from a diagnosis to a treatment plan—the metrics have shown you where the problems are, and now it’s time to act.
From Business Case to Baseline
Your first move is to get genuine buy-in from the top, and the best way to do that is to speak their language. Frame your DEI metrics not just as an HR initiative, but as a solid business case. Use your dashboard to draw direct lines between inclusion scores and employee turnover, or show how a lack of diversity in a key department correlates with lower innovation output.
Once your leadership is on board, it’s time to establish a clear baseline. This means conducting your first comprehensive DEI data audit. This initial snapshot is your “Point A.” It’s the foundation against which all future progress will be measured, giving you an honest look at where your organisation stands today on every key metric.
Setting SMART Goals and Cascading Accountability
With your baseline set, you can start setting goals. Vague ambitions like “improve diversity” are doomed from the start. What you need are SMART goals—Specific, Measurable, Achievable, Relevant, and Time-bound.
Here’s what that looks like in the real world:
- Specific: Increase the representation of women in senior management roles from 15% to 25%.
- Measurable: The goal will be tracked via your HRIS and reported quarterly on the DEI dashboard.
- Achievable: Based on promotion velocity and hiring pipeline data, this is a challenging but realistic target.
- Relevant: This directly tackles the leadership diversity gap you found in your data audit.
- Time-bound: We will achieve this goal within the next 24 months.
But setting goals is only half the battle. Real progress requires cascading that accountability down through the organisation. This means embedding DEI objectives directly into manager performance reviews. When leaders are evaluated and rewarded for their ability to build and support diverse, inclusive teams, DEI stops being a corporate initiative and becomes an operational priority for everyone.
DEI metrics are not a one-time report; they are the fuel for a continuous improvement cycle. The process is simple but powerful: measure your current state, analyse the insights, act on what you’ve learned, and then repeat the cycle.
Building Trust Through Transparent Communication
Finally, you have to be open about your goals, your progress, and even your setbacks. Share high-level DEI metrics and action plans with all your employees and stakeholders. This level of transparency builds trust and proves your commitment to creating a better workplace. When people see the data and understand the “why” behind your initiatives, they’re far more likely to get on board and become active participants in the change.
This continuous loop of measuring, analysing, and acting is how you turn static data points into a dynamic, lasting movement. It’s how you ensure your DEI metrics become the catalyst for building a truly equitable and inclusive organisation.
Frequently Asked Questions About DEI Metrics
Diving into the world of DEI metrics can feel daunting, and it’s natural for practical questions to pop up, especially when you’re just getting your feet wet. Here, we tackle some of the most common queries from HR leaders, offering clear, straightforward answers to help you build out your measurement strategy with confidence.
How Can We Start Measuring DEI With a Small Team and Limited Budget?
You don’t need a massive budget or a dedicated analytics team to get started. The real secret is to start small and stay focused.
Kick things off by tracking foundational DEI metrics that you can probably already pull from your Human Resources Information System (HRIS) or Applicant Tracking System (ATS). Zero in on the core data points like applicant diversity, hire diversity, and overall workforce representation. Even a simple spreadsheet can work perfectly as a basic dashboard to track these numbers over time.
The goal here is consistency. Once you start showing the value and insights from this initial data, you’ll have a much stronger business case for getting more advanced tools and resources down the line. Concentrate on improving one or two key areas first—like gender diversity in your hiring pipeline—to show real, tangible progress.
How Do We Collect Sensitive Data While Respecting Employee Privacy?
Collecting sensitive demographic data all comes down to trust and transparency. The only way to do it right is through voluntary self-identification.
Be crystal clear with all employees about why you’re collecting this data. You need to stress that the goal is to ensure fairness and improve equity, not to single anyone out. Make every submission completely voluntary and guarantee that all data will be anonymised and aggregated for reporting. This is absolutely essential for protecting individual identities and building psychological safety.
Always make sure your data collection and storage practices are fully compliant with local privacy laws, like the Digital Personal Data Protection Act in India. Your first move should be to partner with your legal team to craft clear communication and solid data policies.
What Is the Best Way to Benchmark Our DEI Metrics?
Benchmarking gives your numbers context, but you have to be strategic about it. It can be tempting to compare your organisation to competitors using public data from industry reports, but these comparisons can be misleading. Differences in company size, location, and business model can skew the picture.
A much more powerful approach is internal benchmarking. Track your own organisation’s progress month-over-month and year-over-year. This allows you to set ambitious but realistic goals based on your own starting point.
Ultimately, your biggest competitor should be your past self. Striving for continuous improvement from your own unique baseline is the most meaningful way to measure success and drive change that actually lasts.
Ready to transform your recruitment process with data-driven insights? Taggd specialises in Recruitment Process Outsourcing that embeds DEI principles into every stage of hiring. Let us help you build the diverse, high-performing team your business deserves. Discover how we can partner with you at https://taggd.in.