Contents
- Your Guide to the 7th Pay Matrix Salary Structure
- Decoding the 7th Pay Matrix and Its Purpose
- From Confusion to Clarity: The Old vs. New System
- Key Differences Between 6th CPC and 7th CPC Pay Structures
- Key Advantages of the New Matrix
- How to Read the Salary Map: Pay Levels and Cells
- Understanding Pay Levels: The Vertical Climb
- Understanding Cells: The Horizontal Journey
- Calculating Your Monthly Salary Step by Step
- Step 1: Pinpoint the Basic Pay
- Step 2: Add Key Allowances to the Mix
- Step 3: Calculate Gross Salary and Final Net Salary
- Exploring Your Allowances and Financial Benefits
- The Core Allowances: HRA and TA
- House Rent Allowance (HRA)
- Transport Allowance (TA)
- Specialised Allowances for Unique Roles
- How Your Career and Pay Grow Within the Matrix
- The Two Engines of Salary Growth
- Example of Career and Salary Progression in Pay Level 6
- The Financial Safety Net: Modified Assured Career Progression (MACP)
- The Growing Importance of Performance
- Common Questions About the 7th Pay Matrix
7th Pay Matrix
Your Guide to the 7th Pay Matrix Salary Structure
The 7th Pay Matrix is, at its heart, a simple, consolidated table that spells out the salary for every central government employee. It replaces the old, often confusing system of Pay Bands and Grade Pay. Think of it as a clear roadmap for an employee’s entire financial journey, where every step and milestone is visible from day one. This structure brings much-needed transparency and predictability to how salaries are calculated and grow over time.
Decoding the 7th Pay Matrix and Its Purpose

Before the 7th Pay Commission stepped in, the salary structure for government employees was a complex web. It was built on a foundation of Pay Bands and Grade Pay, a system that was often opaque. This made it incredibly difficult for an employee to chart their financial growth or even compare their standing with others.
The introduction of the 7th Pay Matrix changed all that, simplifying the entire framework into a single, easy-to-understand table.
At its core, the matrix is designed to provide absolute clarity. It maps out all potential salary levels for every central government employee, from entry-level joiners all the way to the highest administrative ranks. For CHROs and HR leaders, understanding this grid is non-negotiable—it directly influences monthly pay, future increments, promotions, and even pension calculations.
From Confusion to Clarity: The Old vs. New System
The primary goal behind this shift was to create a more rational and transparent pay structure. The old method forced employees to track two separate components—their Pay Band and their Grade Pay—which together determined their seniority and salary. It wasn’t always intuitive. The new system rolls these into a single, straightforward figure within the matrix.
This change wasn’t just a cosmetic touch-up; it was a fundamental overhaul of the government’s compensation philosophy.
To help you see the difference clearly, here’s a quick comparison:
Key Differences Between 6th CPC and 7th CPC Pay Structures
| Aspect | 6th Pay Commission (Old System) | 7th Pay Matrix (New System) |
|---|---|---|
| Basic Structure | Based on Pay Bands and Grade Pay. | A single, consolidated matrix with Levels and Cells. |
| Complexity | Complex and often confusing for employees to track. | Simple, transparent, and easy to understand at a glance. |
| Salary Calculation | Basic Pay = Pay in the Pay Band + Grade Pay. | Basic Pay is the specific figure shown in a Level and Cell. |
| Progression | Progression involved moving up Pay Bands and Grade Pay. | Progression is a clear horizontal and vertical movement in the matrix. |
| Transparency | Lacked a clear view of the entire career pay path. | Provides a complete, predictable view of career-long earnings. |
As you can see, the new system is a massive leap forward in terms of simplicity and usability for everyone involved.
One of the most significant recommendations was this unified Pay Matrix, which spans 19 levels and 40 stages and covers all employee categories without adding new, confusing levels. A key feature was the adoption of a uniform fitment factor of 2.57. This factor was used to multiply the previous pay scales to arrive at the new revised salary, leading to an average salary increase of about 23.35%. You can learn more about the recommendations and their financial impact from this detailed report on the 7th CPC.
Key Advantages of the New Matrix
The move to the 7th Pay Matrix brought several immediate and tangible benefits for both employees and human resources departments:
- Enhanced Transparency: Employees can now see their current salary and future pay progression clearly laid out. No more guesswork.
- Simplified Administration: Calculating salaries, increments, and promotional benefits has become a much more straightforward process for HR and accounts departments.
- Elimination of Discrepancies: The previous system could sometimes lead to pay anomalies between different posts. The matrix ensures consistency and fairness across the board.
- Predictable Growth: The clear structure makes it easy to predict future earnings, which is a massive help for employees trying to do any long-term financial planning.
Ultimately, this transition from the 6th Pay Commission’s structure to the modern 7th Pay Matrix marks a significant milestone in public sector compensation management.
How to Read the Salary Map: Pay Levels and Cells
To really get a handle on an employee’s salary, you need to learn how to read its map—the 7th Pay Matrix itself. At first glance, this grid can look a bit intimidating, but it’s actually built on two straightforward concepts: Pay Levels and Cells. Get these two down, and you’ve cracked the code for the entire salary structure of any government employee.
Think of the matrix as a giant apartment building. The floors are the ‘Pay Levels,’ and the apartments on each floor are the ‘Cells.’ It’s a simple way to picture how an employee’s career path and salary are laid out.
Understanding Pay Levels: The Vertical Climb
The Pay Levels are the vertical columns in the matrix, running from 1 to 18. Each level corresponds directly to a different rank or grade within the government hierarchy. Level 1 is the starting block for entry-level roles, while Level 18 is the top floor, reserved for the highest-ranking officials like the Cabinet Secretary.
When an employee gets a promotion, they don’t just get a simple pay bump; they effectively move to a higher floor in our apartment building analogy. This means they jump to a higher Pay Level, which opens up a whole new, and significantly higher, range of potential salaries. So, the Pay Level is a clear indicator of an employee’s functional status and seniority.
This infographic helps to visualise the tiered structure of these matrix levels.
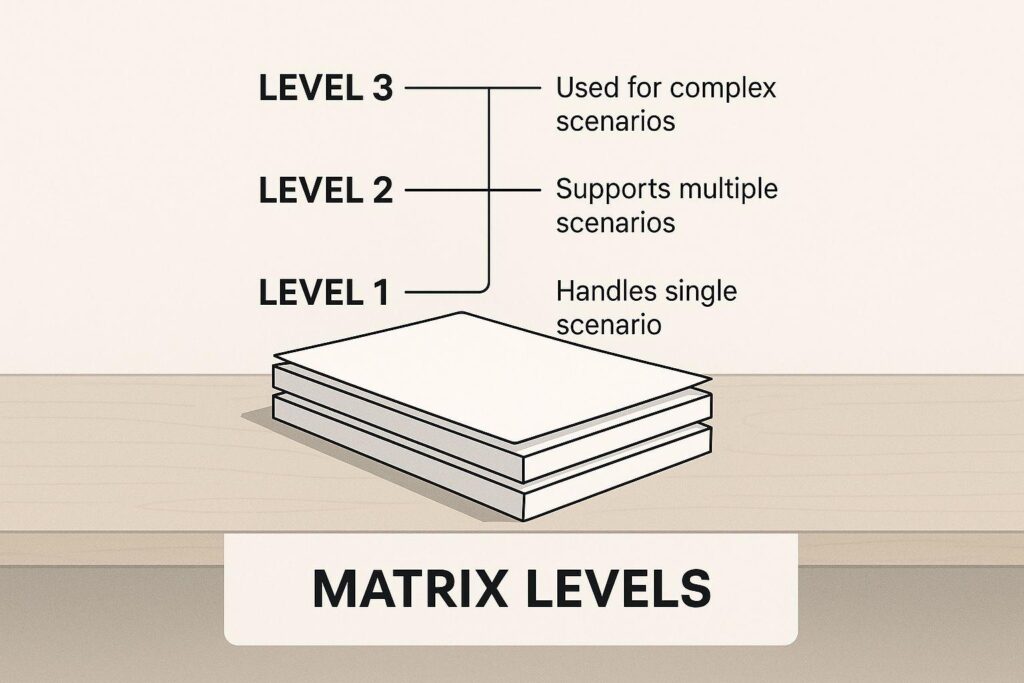
As you can see, each level builds on the last, creating a clear and structured path for career advancement.
Understanding Cells: The Horizontal Journey
So, if Pay Levels are the floors, then Cells are the individual apartments on each floor. These are the horizontal entries in the matrix, numbered from 1 to 40 within each Pay Level. The Cells represent the annual increments an employee earns for their years of service within a particular grade.
Each year, an employee moves one cell to the right within their current Pay Level. This move represents a standard annual increment, which equates to a pay raise of approximately 3% of their Basic Pay.
This horizontal move is predictable and pretty much automatic. It ensures that an employee’s salary grows steadily every year, even if they aren’t up for a promotion.
Let’s walk through a quick example to see it in action:
- An employee is hired at Pay Level 3. Their starting Basic Pay will be the amount listed in Cell 1 of Level 3.
- After one year of service, they shift over to Cell 2 of Level 3, and their Basic Pay increases to the corresponding figure in that cell.
- This process repeats year after year, with the employee moving horizontally across the cells until they either get promoted to a higher Pay Level or hit the final cell for their current level.
This dual-axis system of vertical ‘Levels’ and horizontal ‘Cells’ creates a completely transparent and easy-to-follow map. It empowers both employees and CHROs to see exactly where an individual stands financially and to chart their potential salary growth over their entire career. It cuts through the old ambiguity and provides a clear, predictable framework for compensation. By understanding this grid, you can pinpoint any employee’s Basic Pay with just two coordinates: their Pay Level and their current Cell.
Calculating Your Monthly Salary Step by Step
Understanding the theory behind the 7th Pay Matrix is one thing, but the real test is seeing how it translates into an actual monthly salary. At first glance, the process might seem tangled with its different components, but it really follows a clear, logical sequence. By breaking it down piece by piece, you can easily figure out an employee’s total earnings.
Think of it like building with Lego blocks. You start with the main foundation block—the Basic Pay—and then carefully click the other critical pieces like allowances into place. Finally, you take away a few blocks for deductions to see the final structure: the net take-home salary. Let’s walk through this together with a practical example to make it crystal clear.
Step 1: Pinpoint the Basic Pay
The entire salary calculation hinges on one central figure: the Basic Pay. This is the fixed, core amount an employee receives before any allowances are added or deductions are made. It’s the very foundation of the compensation structure under the 7th Pay Matrix.
To find this number, you just need two bits of information:
- The employee’s Pay Level (for example, Level 6)
- The employee’s current Cell within that level (for example, Cell 4)
All you have to do is find where that specific Level and Cell intersect on the official 7th Pay Matrix chart. The number you see there is the employee’s monthly Basic Pay. It’s that straightforward—no complicated formulas are needed for this first, crucial step.
Step 2: Add Key Allowances to the Mix
Once you have the Basic Pay locked in, it’s time to start layering on the allowances. While there are many possible allowances, three core components apply to nearly every central government employee: Dearness Allowance (DA), House Rent Allowance (HRA), and Transport Allowance (TA). These are usually calculated as a percentage of the Basic Pay or as a fixed amount.
Dearness Allowance (DA) DA is essentially a cost-of-living adjustment. It’s given to employees to help soften the impact of inflation on their wallets. The amount is calculated as a specific percentage of the Basic Pay.
Crucially, the DA percentage isn’t set in stone. The government revisits it periodically, typically twice a year, based on inflation rates measured by the All India Consumer Price Index (AICPE-IW).
For instance, if the current DA rate is 50%, an employee with a Basic Pay of ₹40,000 would get a DA of ₹20,000 (which is 50% of ₹40,000).
House Rent Allowance (HRA) HRA is there to help employees with their rental accommodation costs. The HRA percentage is also tied to the Basic Pay, but it changes depending on where the employee is posted. Cities are grouped into three categories:
- X Cities: Major metros like Delhi, Mumbai, and Bengaluru.
- Y Cities: Other large cities with significant populations.
- Z Cities: All the remaining towns and rural areas.
The HRA rates were updated recently. After the DA was hiked to 50%, the HRA rates were revised to 30% for X cities, 20% for Y cities, and 10% for Z cities.
Transport Allowance (TA) TA is provided to cover the daily commute between an employee’s home and their workplace. Unlike DA and HRA, TA is often a fixed amount that changes based on the employee’s pay level and city. It makes sense—higher-level employees in major cities usually receive a higher TA. On top of that, DA is also applied to the Transport Allowance itself.
Step 3: Calculate Gross Salary and Final Net Salary

With all the main components in hand, you can now calculate the Gross Salary. This is the total monthly earning before any mandatory deductions are taken out.
Gross Salary = Basic Pay + Dearness Allowance + House Rent Allowance + Transport Allowance + Other Applicable Allowances
After figuring out the Gross Salary, the final step is to subtract the required deductions. The most common one is the contribution to the National Pension System (NPS), which is typically 10% of the (Basic Pay + Dearness Allowance). Other deductions might include professional tax and income tax (TDS).
Net Salary = Gross Salary – Total Deductions (NPS, Tax, etc.)
The number you’re left with is the employee’s take-home pay—the actual amount that hits their bank account each month. By following these steps, both HR managers and employees can get a perfectly clear and accurate picture of their monthly pay under the 7th Pay Matrix.
Exploring Your Allowances and Financial Benefits
An employee’s salary is far more than just the Basic Pay listed in the 7th Pay Matrix. The real story of their compensation package unfolds when you start adding in the wide array of allowances. These aren’t just arbitrary add-ons; they are carefully structured benefits that account for an employee’s specific life situation, from the city they live in to the unique challenges of their job.
For any CHRO, getting a handle on these allowances is absolutely critical. They are the government’s strategic tools for building a fair, motivating pay structure that flexes to meet different living costs and job demands across the country. Essentially, they’re what turns a static Basic Pay figure into a dynamic, real-world total salary.
The Core Allowances: HRA and TA
While a whole host of specialised benefits exist, two allowances form the foundation of almost every central government employee’s salary: House Rent Allowance (HRA) and Transport Allowance (TA). Think of these as the essentials, designed to soften the blow of fundamental costs like living and commuting.
House Rent Allowance (HRA)
This allowance tackles one of the biggest and most variable expenses anyone faces: rent. The government recognises that rent in Mumbai is worlds apart from rent in a smaller town. So, HRA is calculated as a percentage of Basic Pay, and that percentage changes based on the city of posting.
For HRA purposes, cities are grouped into three tiers:
- X Cities: These are your major metropolitan hubs where the cost of living is highest.
- Y Cities: This tier covers other large cities and significant urban areas.
- Z Cities: This includes all the remaining towns and rural locations.
With the recent Dearness Allowance (DA) hike to 50%, the HRA rates also got a boost. They now stand at 30%, 20%, and 10% of Basic Pay for X, Y, and Z cities, respectively. This tiered system makes a real difference, ensuring an employee posted in a pricey metro gets substantially more housing support than one in a quieter, more affordable town.
Transport Allowance (TA)
TA is straightforward: it’s there to cover the daily grind of commuting to and from the office. It’s usually a fixed monthly amount that changes based on an employee’s Pay Level and their city, with an additional DA component layered on top.
Specialised Allowances for Unique Roles
Moving beyond the standard HRA and TA, the 7th Pay Commission made some significant and much-needed refinements to specialised allowances. These are all about fairly compensating employees who work in tough conditions or perform duties with specific hardships, making sure their take-home pay truly reflects the challenges they face.
The 7th Pay Commission didn’t just tweak allowances; it completely revamped the structure for better clarity and standardisation. It brought in a range of new and revised allowances designed specifically to compensate for job-related hardship and unique posting conditions.
Take the Hard Area Allowance, for instance. This was set at 25% of basic pay or ₹6,750 per month (whichever is higher) for officers posted in difficult terrain. Similarly, the High Altitude Climate Allowance and Siachen Allowance were fixed between ₹11,200 and ₹14,000 per month for officers serving in those punishing climates. These aren’t minor perks; they significantly boost the total salary for these demanding roles. You can dig into more specifics on how the 7th Pay Commission restructured these pay scales and allowances on Cleartax.
Other crucial hardship allowances include:
- Children Education Allowance (CEA): A fixed amount per child to help with school expenses.
- Risk and Hardship Allowance: A broad category covering a variety of tough job conditions.
- Special Duty Allowance: For employees posted in specific regions like the North-Eastern states.
These specialised benefits are vital for keeping morale high and ensuring people in roles critical to national security and governance are properly compensated. It shows a sophisticated approach to compensation that goes way beyond a simple base salary. For HR professionals, understanding this system is key, as it impacts everything from employee satisfaction to workforce deployment. To further assist in managing these complexities, check out our guide on how to ease the online recruitment process for HR professionals, which can help streamline attracting candidates for these specialised government roles.
How Your Career and Pay Grow Within the Matrix
The 7th Pay Matrix isn’t just a salary chart; it’s a career roadmap. It lays out the entire professional journey for a government employee, showing exactly how their pay will grow over time. There are two main ways this happens: the small, steady bumps you get every year, and the big jumps that come with a promotion.
Getting a handle on these two mechanisms is the key to understanding how a government salary evolves. It’s a transparent system that shows you a clear path forward, rewarding both your loyalty and your performance.
The Two Engines of Salary Growth
Think of your salary progression like a car with two gears. You have a reliable, everyday gear that keeps you moving forward consistently, and a high-performance gear you shift into for a major boost.
- Annual Increment (Horizontal Movement): This is the most dependable part of your pay growth. Every year, you automatically move one step, or Cell, to the right within your current Pay Level. This simple horizontal shift gives you a predictable raise of about 3% on your Basic Pay. It’s the system’s way of rewarding you for another year of service.
- Promotion (Vertical Jump): This is where things get exciting. A promotion isn’t just a small step—it’s a huge leap. You jump up to an entirely new, higher Pay Level. This move comes with a substantial hike in your Basic Pay, setting you on a completely new salary path with a much higher potential for future earnings.
Example of Career and Salary Progression in Pay Level 6
To see how this works in practice, let’s trace the journey of an employee who starts in Pay Level 6. This table shows how their salary grows through annual increments and what happens when they get a promotion.
| Year of Service | Pay Level | Cell | Basic Pay (in ₹) | Event |
|---|---|---|---|---|
| Year 1 | 6 | 1 | 35,400 | Joins Service |
| Year 2 | 6 | 2 | 36,500 | Annual Increment |
| Year 3 | 6 | 3 | 37,600 | Annual Increment |
| Year 4 | 6 | 4 | 38,700 | Annual Increment |
| Year 5 | 7 | 1 | 44,900 | Promotion |
As you can see, the employee receives a steady, predictable raise each year. But the promotion in Year 5 provides a massive financial boost, moving them to a higher pay scale entirely.
The Financial Safety Net: Modified Assured Career Progression (MACP)
But what if promotions don’t come around as expected? It’s a valid concern, and the government has a solution in place: the Modified Assured Career Progression (MACP) scheme. This is a crucial financial safety net designed to prevent pay stagnation.
The MACP scheme guarantees that an employee moves to the next higher Pay Level after a set period of service—usually 10, 20, and 30 years—even if they haven’t received a formal promotion. It ensures that your income keeps pace with your experience, regardless of whether a higher-level post becomes available.
For example, an employee who has been in the same role for 10 years without being promoted will be financially upgraded to the next Pay Level. Their job title and responsibilities might stay the same, but their Basic Pay and all related allowances will now be calculated based on that higher level. This provides a significant financial uplift and ensures long-term career growth. For those mapping out their future, exploring different career growth strategies can provide valuable perspectives on how to make the most of these systems.
The Growing Importance of Performance
Here’s a critical change under the 7th Pay Matrix: these financial progressions are no longer just about how long you’ve been on the job. Performance is now a major factor. To even qualify for a MACP upgrade, an employee needs to have a consistent record of ‘Very Good’ performance.
This is a big shift from the old days. It ties financial rewards directly to how effective you are in your role. What’s more, departments now have the authority to withhold annual increments from employees who aren’t meeting their performance standards. This introduces a real layer of accountability, making sure the system rewards those who are truly performing.
Common Questions About the 7th Pay Matrix
Getting to grips with the 7th Pay Matrix can throw up a few questions, especially when you start applying it to your own situation. Let’s walk through some of the most common queries to clear up any confusion and make sure the concepts are crystal clear.
How Do I Find My Pay Level and Cell?
Figuring out your spot on the matrix is actually quite straightforward.
Your Pay Level is tied directly to your grade or post when you were appointed or last promoted. The Cell number simply reflects how many years of service you’ve completed in that specific Pay Level.
You don’t have to guess this information. It’s always officially documented, so you can easily find your current Pay Level and Cell on your monthly salary slip, your original appointment letter, or your most recent promotion order.
What Was the Fitment Factor?
The fitment factor was a one-time calculation used to shift everyone from the old 6th Pay Commission structure to the new 7th Pay Matrix. The commission set a uniform fitment factor of 2.57 for this transition.
Basically, to get an employee’s new Basic Pay, their old Basic Pay (which combined the Pay in Pay Band and Grade Pay) was multiplied by 2.57. This was a one-off calculation done back in 2016 to ensure a fair and smooth move to the higher pay scales of the new matrix.
Does My HRA Change If I Move to a Different City?
Yes, it absolutely does. Your House Rent Allowance (HRA) is directly linked to where you are posted. It’s calculated as a percentage of your Basic Pay, and that percentage changes based on whether the city is classified as X, Y, or Z.
For instance, if you’re transferred from a Z-category town (where HRA might be 10% of your Basic Pay) to a big metro like Delhi, an X-category city (where HRA is 30%), your HRA will jump up significantly. This boosts your total monthly salary and is designed to reflect the real differences in the cost of living across India.
What Happens to My Pay Upon Promotion?
A promotion comes with a structured and meaningful pay bump. First, you get a “notional increment” in your current Pay Level, which means you move one cell to the right.
From there, your pay is fixed in the new, higher Pay Level. You land on the cell that has a value equal to or just above this new figure. It’s a system designed to guarantee a substantial financial reward with every step you take up the career ladder. As hiring keeps changing, understanding this kind of progression is crucial, a point we dig into in our analysis of recent hiring trends.
At Taggd, we specialise in simplifying complex HR processes. If you’re looking to optimise your recruitment strategy, explore our Recruitment Process Outsourcing solutions at https://taggd.in.