Selection Ratio Decoded: Master This Key Recruitment Metric
Understanding Selection Ratio: Your Hiring Health Check
 Think of your selection ratio as a quick health screening for your recruitment efforts. Much like checking your blood pressure gives you a snapshot of your physical health, this simple metric reveals the condition of your hiring process. The formula itself is straightforward: the number of candidates hired divided by the total number of applicants.
But don’t let that simplicity fool you. This one number tells a deep and meaningful story about your company’s reputation, its standing in the job market, and the overall effectiveness of your talent pipeline. A startup and a global corporation might have vastly different ratios for the exact same position. It directly links the quality of your applicants to your time-to-hire, making it a vital tool for making better hiring choices. Learning to interpret your selection ratio is the first step toward a stronger recruitment strategy.
What Different Ratios Really Mean
A specific selection ratio isn’t “good” or “bad” on its own; it’s a diagnostic tool that requires context. A very low ratio, like 2%, might seem positive at first glance, suggesting you’re highly selective and have a strong brand that attracts tons of applicants. However, it could also mean your job descriptions are too vague, pulling in a massive volume of unqualified people and wasting your team’s time.
On the other hand, a high ratio, say 20% or more, might point to a well-oiled machine where nearly every applicant is a strong contender. But it can also be a serious red flag. It could signal that your job postings aren’t reaching enough people, your compensation is falling short of the market rate, or your employer brand isn’t compelling enough to draw a large pool of talent. This leaves you picking from a small group, possibly missing out on the best candidates. The goal is to dig into the story behind the numbers.
This principle of context applies far beyond the corporate world. Take the incredibly competitive field of higher education in India. The selection ratio for elite engineering and medical schools is extraordinarily low. This is driven by massive population growth; India’s population has swelled from about 169 million people in 1800 to over 1.3 billion today. This creates a huge applicant pool competing for a fixed number of spots. Explore these historical population trends to see the scale of this growth. In this case, a low ratio is a clear indicator of intense competition and the high desirability of the institution.
Mastering Selection Ratio Calculations That Actually Matter
Getting a true sense of your hiring effectiveness goes beyond simple arithmetic. While the basic selection ratio formula is straightforward, applying it in the real world reveals complexities that can easily distort your data if you’re not careful. The secret is knowing which numbers tell the real story and which are just noise.
The Core Calculation
At its most basic, the formula is Number of Hires ÷ Total Number of Applicants. For instance, if you get 100 applications for a job and end up hiring 5 people, your selection ratio is 5 ÷ 100, which gives you 0.05 or 5%. This is your 30,000-foot view, a high-level measure of how selective your hiring funnel is.
The chart below offers a clear visual of this relationship between the initial pool of applicants and the final hires.
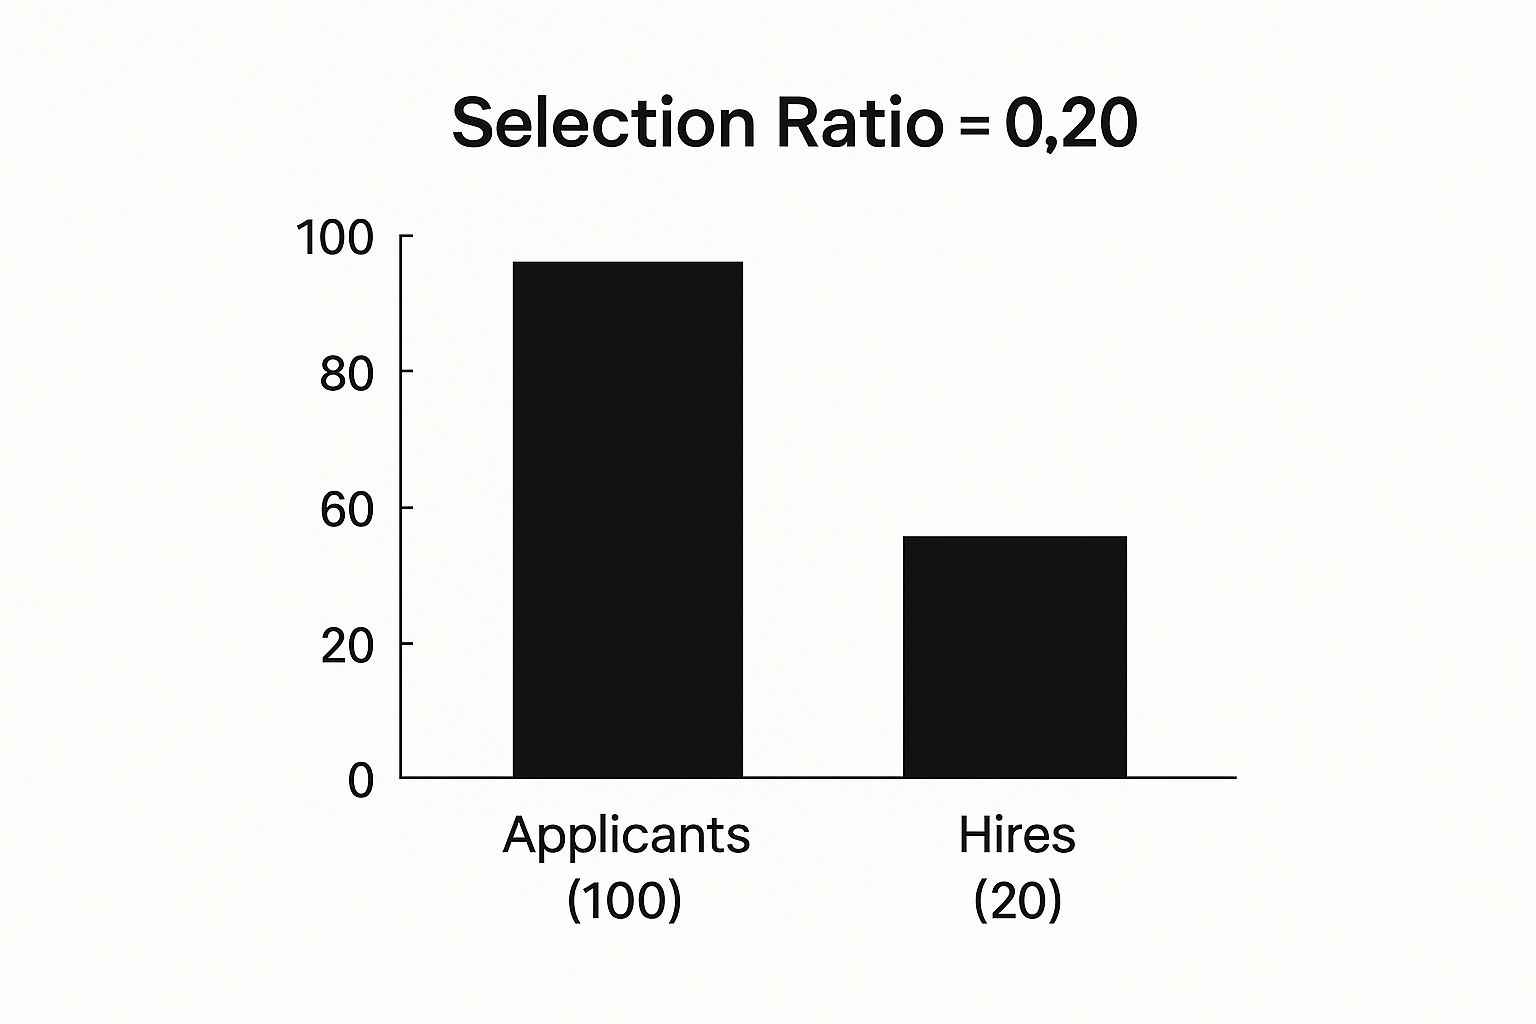
As you can see, turning 100 applicants into 20 hires results in a selection ratio of 0.20. This means that for this particular role, one in every five people who applied was ultimately successful.
Selection Ratios Across Different Industries
A “good” selection ratio isn’t a universal number; it changes dramatically based on the industry and the specific role you’re hiring for. The following table shows how this plays out in different sectors.
Selection Ratio Calculation Examples by Industry
Comparative examples showing how selection ratios are calculated across different sectors with varying applicant volumes
| Industry | Total Applicants | Hired Candidates | Selection Ratio | Industry Context |
|---|---|---|---|---|
| Technology | 500 | 2 | 0.4% | Highly competitive roles like software engineering attract a massive applicant pool for very few spots. |
| Retail (Seasonal) | 1,000 | 100 | 10% | High-volume, entry-level hiring means a much larger percentage of applicants are hired. |
| Healthcare | 50 | 5 | 10% | Fewer applicants, but they are often pre-qualified. The ratio is higher, reflecting a need for certified professionals. |
| Executive Search | 20 | 1 | 5% | A very small, curated pool of candidates for a single C-suite position makes this an extremely selective process. |
As the examples show, a 0.4% selection ratio in tech can be just as healthy as a 10% ratio in retail. Context is everything.
Navigating Real-World Complexities
To get an accurate picture, you have to dig into the details. What happens when a great candidate withdraws their application before the final interview? Or when your top choice rejects your job offer? These scenarios aren’t the same as an unqualified applicant, and treating them as such can skew your data. A withdrawal could hint at a slow hiring process, while a rejected offer may point to compensation that isn’t competitive.
To protect the integrity of your data and calculate a meaningful selection ratio, it’s vital to sidestep these common mistakes:
- Counting Every Single Application: Don’t let spam resumes or completely unqualified applications bloat your “Total Applicants” number. Doing so will artificially deflate your ratio and hide problems in your sourcing strategy.
- Ignoring Role Differences: You can’t compare apples to oranges. A high-volume hiring campaign for seasonal staff should never be lumped in with a search for a senior executive. Their ratios will—and should—be completely different.
- Inconsistent Tracking: Ensure every hiring manager and department is on the same page. You need a consistent definition of what counts as an “applicant” versus a “qualified candidate” to get clean data.
Using the right tools, whether a well-organized spreadsheet or dedicated HR software, can help automate these calculations and prevent manual errors. Mastering the math behind your selection ratio isn’t about becoming a statistician. It’s about building a reliable metric to make smarter decisions about your talent strategy and where to invest your resources.
Decoding Industry Benchmarks: What Your Numbers Really Mean

Comparing your company’s selection ratio to another without context is like comparing apples to oranges. A 3% ratio at a globally recognized tech company might be a badge of honor, showing immense brand appeal. Meanwhile, a 20% ratio at a specialized manufacturing plant could signal a highly effective, targeted recruitment search. On their own, the numbers don’t tell the full story.
A low ratio isn’t automatically good, and a high one isn’t automatically bad. Your selection ratio is a direct reflection of your specific hiring situation. Getting this wrong can lead to poor decisions, like changing a recruiting process that is actually working perfectly or sticking with one that is driving away great candidates. The goal is to measure your performance against what is normal for your industry, role type, and market.
Why Industry and Role Type Matter
The two biggest factors that shape your selection ratio are your industry and the seniority of the role you’re filling. Think about the difference between a large IT firm in Bengaluru hiring for 100 entry-level developer spots and a luxury hotel in Mumbai looking for one new general manager. The IT firm is dealing with massive applicant volume and needs an efficient screening process, while the hotel needs to be incredibly precise in its search.
This is exactly why one-size-fits-all benchmarks don’t work. A healthy ratio is completely dependent on the job’s demands and the talent available. The table below provides a much clearer picture by breaking down typical benchmarks.
To help you find a more accurate point of comparison, here is a breakdown of typical selection ratio ranges across major sectors and experience levels.
Selection Ratio Benchmarks by Industry and Role Type
Comprehensive benchmark data showing typical selection ratio ranges across different industries and position levels
| Industry/Sector | Entry Level | Mid Level | Senior Level | Specialized Roles | Market Conditions |
|---|---|---|---|---|---|
| Information Technology | 1% – 3% | 2% – 5% | <1% | <1% | High Applicant Volume |
| Retail / FMCG | 10% – 20% | 5% – 10% | 2% – 4% | 3% – 6% | Seasonal & Volume Hiring |
| Manufacturing | 5% – 8% | 3% – 6% | 1% – 3% | 2% – 5% | Skill-Specific Needs |
| BFSI | 4% – 7% | 2% – 5% | <2% | <2% | High Regulation |
As you can see, ratios for senior and specialized roles are consistently lower across all industries, reflecting a much smaller, more competitive talent pool. In contrast, entry-level positions, especially in high-volume sectors like retail, naturally have higher ratios.
Beyond Industry: External Market Forces
Your selection ratio is also influenced by powerful forces outside of your immediate control. To truly understand what your numbers are telling you, you have to look at the bigger picture:
- Company Size & Brand: It’s no surprise that large, well-known companies get flooded with applications for every opening. This high volume naturally drives their selection ratios down.
- Geographic Location: The talent pool for a job in a major metro area like Delhi is vastly different from that in a Tier-2 city. Local market dynamics play a huge role.
- Seasonality: A travel company’s hiring metrics will look very different right before the peak holiday season compared to the slow off-season.
Wider economic trends also have a direct impact. For example, India’s national employment-to-population ratio is a strong signal of how tight the labor market is. When this number changes, it affects how many people are actively job-seeking, which in turn influences your applicant volume. You can discover more about these economic indicators to get a better sense of these trends. This is why a ratio that was considered healthy two years ago might mean something entirely different today.
Reading Between The Lines: What Your Selection Ratio Reveals
Your selection ratio is much more than a simple metric; it’s a story about your hiring process. It acts as a diagnostic tool, shining a light on hidden problems—from a weak employer brand to a clunky application process—long before they become full-blown crises. The real skill is learning how to read the trends and understand the narrative behind the numbers.
What a Changing Selection Ratio Signals
A sudden, sharp drop in your selection ratio might feel like a victory. You’ve attracted a massive pool of applicants, making your company appear incredibly selective. But this isn’t always the cause for celebration some leaders think it is. Many have celebrated a 1% ratio, only to realize their pipeline was flooded with candidates who were not a good fit.
This kind of shift often points to a problem with the job description itself. Perhaps it was written too broadly, inviting applications from everyone instead of attracting the right people. A steep drop can mean your team is now spending far more time weeding out unqualified applicants than engaging with promising ones, turning perceived selectivity into a major time sink.
Investigating the Root Causes
When your numbers start to look unusual, it’s time to play detective. By taking an honest look at the process, HR teams can pinpoint what’s causing a problematic selection ratio. The most common culprits are often right in front of you:
- Vague Job Descriptions: A poorly defined role is a double-edged sword. It can scare away qualified candidates who feel they don’t meet the strange or confusing criteria, while also attracting a high volume of applicants who don’t truly understand the job’s demands.
- Uncompetitive Compensation: If your salary and benefits packages aren’t aligned with what the market is offering, you’ll see a spike in offer rejections. This directly hurts your final hiring numbers, skews your ratio, and exposes a critical weakness in your talent strategy.
- A Flawed Interview Process: A lengthy, disorganized, or simply poor candidate experience will cause top talent to withdraw their applications. If you consistently lose great people halfway through the process, the problem isn’t your talent pool—it’s your process.
The most successful companies use their selection ratio to look at the road ahead, not just in the rearview mirror. They analyze data to anticipate future hiring challenges and adjust their strategies before issues arise. For instance, India is experiencing major demographic changes. By 2030, the country’s dependency ratio is expected to be just over 0, meaning a massive wave of young people will be entering the workforce.
This will naturally intensify competition for jobs and drive selection ratios lower across the board. Understanding these demographic trends in India allows you to turn a simple metric into a powerful tool for strategic planning.
Smart Strategies For Optimizing Your Selection Ratio
 Knowing your selection ratio is one thing, but using that number to make meaningful changes is where you gain a real edge. Whether your ratio is extremely low, suggesting a broken process, or surprisingly high, pointing to a small talent pool, the goal is to adjust your strategy. Improving this metric means finding the sweet spot between being selective and being efficient, so you can attract top performers without burning out your hiring team.
Fine-Tuning a Low Selection Ratio
A very low ratio, such as 1-2%, is often a sign that your recruiting funnel is too wide. It’s getting clogged with a massive volume of unqualified or irrelevant applications. This not only wastes recruiter time but also significantly slows down your hiring. The fix isn’t about getting fewer applicants, but getting the right ones.
- Rewrite Job Descriptions for Clarity: Ditch the long, intimidating wish lists. Instead, clearly divide your requirements into two groups: “must-have” qualifications and “nice-to-have” skills. This simple tweak helps candidates self-filter, so those who aren’t a good fit move on before they even apply.
- Implement Pre-Screening Tools: Use automated knockout questions or brief, role-specific assessments at the start of the application process. This acts as an instant filter, shrinking the applicant pool to a more qualified and manageable size. It allows your team to stop sorting and start engaging with the best candidates.
Addressing a High Selection Ratio
On the flip side, a high selection ratio of 20% or more can be a major warning sign. It suggests you have a scarcity of candidates, which puts you in a dangerous position. You might feel pressured to make a hire from a weak pool of applicants simply because there are no other options. The goal here is to cast a wider net and make it simpler for great people to find and apply to your roles.
First, take a hard look at your application process. Is it too long or overly complex? Research shows that 60% of job seekers have abandoned an application because of its length or difficulty. Cut down your forms to the essentials and make sure the entire experience is seamless on a mobile device.
Next, review your sourcing channels. If you are only posting on one or two major job boards, you are missing out on a huge portion of the talent market. Look into niche platforms for your industry, participate in specific online forums, and build up your employee referral program to access new and diverse talent networks.
Turning Data Into Strategic Action
Your selection ratio data becomes most valuable when you use it to guide bigger business decisions. When presenting these figures to leadership, you need to tell a story. Don’t just show a number; explain what that number means for the company’s performance and bottom line.
Connect a low selection ratio to a higher cost-per-hire and a longer time-to-fill, both of which directly impact budgets and productivity. Frame a high ratio as a critical risk to talent quality and future innovation. Use this evidence to build a case for investing in better sourcing technology, employer branding campaigns, or process improvements. By demonstrating how a healthier talent funnel supports key business goals, you can get the support needed to build a more effective hiring machine. For more ideas, you can explore some unique recruitment strategies to hire talent effortlessly.
Avoiding Selection Ratio Mistakes That Cost You Talent
Your selection ratio can be an incredibly insightful recruiting metric, but it’s also surprisingly easy to misread. Falling into a few common traps can turn this helpful number into a misleading one. These mistakes don’t just mess up your spreadsheets; they can cause you to make poor hiring choices, lose out on great candidates, and burn through your budget.
The Dirty Data Dilemma
A very common mistake is working with “dirty” applicant data. This occurs when your “total applicants” figure includes every submission received, from spam and bots to people who are completely unqualified for the role.
Imagine a bakery owner counting every person who walks past the window as a customer. It paints a wildly inaccurate picture of actual interest. Including junk applications in your calculation artificially lowers your selection ratio, making it seem like you have a huge, competitive talent pool when you might actually have a problem with your sourcing strategy.
How to Fix It:
- Define a “Qualified” Applicant: Before you calculate anything, create a clear, simple definition of what a qualified candidate looks like for a specific role.
- Check Your Tech: Your Applicant Tracking System (ATS) is your first line of defense. Regularly review its settings to make sure it’s properly filtering out unqualified and junk submissions, as this is often where the bad data sneaks in.
The Flaw of False Comparisons
Another major pitfall is comparing apples to oranges. The selection ratio for a senior software engineer in Mumbai will naturally be worlds apart from the ratio for a seasonal retail position in Jaipur.
Trying to compare these two directly or lumping them into one average is pointless and will only lead to bad decisions. It’s also a mistake to overreact to short-term changes. A single-month dip or spike in your ratio isn’t usually a sign of a crisis; it’s often just statistical noise.
How to Fix It:
- Segment Your Data: Always break down your ratios by department, role seniority, and location to get a true picture.
- Look for Trends, Not Blips: Analyze your data over several months or quarters. This helps you spot real patterns instead of reacting to every small fluctuation.
Forgetting the “Why” Behind the Numbers
The biggest mistake of all is looking at your selection ratio without any context. A number on its own is just a number—it doesn’t tell you a story.
For instance, is a low ratio a sign that your employer brand is so strong you’re attracting a flood of top applicants? Or is it a red flag that your job description is vague and drawing in a lot of unqualified people? Getting this interpretation wrong can lead you to hire people who aren’t a good fit, which harms employee retention down the line.
Understanding the story behind your data is crucial for building a team that stays. In fact, a strong hiring process is the first defense against turnover. You can learn more in our article about employee attrition and how to prevent it. When you truly understand your hiring metrics, you’re on your way to building a more committed and successful team.
Turning Selection Ratio Insights Into Hiring Success
Data is only useful when you do something with it. A raw selection ratio is just a number on a page; its true power is unlocked when you use it to build a smarter, more effective hiring process. This is where you move from just observing data to making strategic moves that lead to real hiring wins.
Creating a Hiring Health Dashboard
Looking at your selection ratio in a vacuum is like trying to fly a plane by only looking at the fuel gauge. You need to see your altitude, speed, and heading to understand the full picture. To get a true sense of your hiring health, you must track your selection ratio alongside other vital recruitment metrics.
A complete dashboard gives your numbers context and helps you understand the story they’re telling. Consider tracking these metrics together:
- Quality of Hire: Is there a connection between your selection ratio and how well new employees perform months down the line?
- Time-to-Fill: Is a very low ratio slowing you down because recruiters are buried under a mountain of applications for critical roles?
- Cost-per-Hire: How much money and time is being spent sifting through unqualified candidates from an oversized applicant pool?
- Candidate Experience Score: Are great candidates dropping out because of a clunky process, which in turn impacts your ratio and employer brand?
Troubleshooting Common Selection Ratio Problems
When your selection ratio starts flashing a warning light, you need a clear action plan. Here’s a simple guide to diagnose and fix common issues, helping you improve your hiring outcomes.
- Warning Sign: The Ratio is Too Low (<2%)
- The Problem: Your hiring funnel is probably clogged with a high volume of unqualified applicants, which is overwhelming your team.
- The Action: Refine your job descriptions. Get crystal clear on the difference between “must-have” skills and “nice-to-have” qualifications. Use automated knockout questions in your application form to instantly filter out candidates who don’t meet the absolute basic requirements.
- Warning Sign: The Ratio is Too High (>15%)
- The Problem: You have a small talent pool to choose from, which increases the risk of making a poor hiring decision simply because options are limited.
- The Action: Review and broaden your sourcing channels. Are you relying too much on one or two job boards? Also, simplify your application. If it takes longer than five minutes to complete, you are losing top-tier talent to your competitors.
Presenting Insights to Drive Change
To get support from leadership, you have to connect your selection ratio findings to the company’s bottom line. Don’t just present the numbers; tell a story about their business impact. For example, frame a low ratio as a direct cause of project delays or increased operational costs from wasted time.
Come to the table with clear solutions, measurable goals, and a realistic timeline for seeing improvements. This shows you’re thinking strategically and builds a compelling case for getting the resources you need to accelerate your recruitment process.
It’s time to stop just tracking metrics and start using them to get results. Taggd can help you transform your hiring data into a powerful advantage. Learn how our RPO solutions build winning teams.