Hiring today is not just about filling roles. It is about balancing speed, quality, and candidate experience in an increasingly competitive market. In fact, 75% of candidates say they never hear back after applying, highlighting clear gaps in how hiring processes are structured and executed.
For CHROs and talent leaders, the hiring process is no longer operational. It is a direct driver of business outcomes. A great hiring process is the engine that drives your organisation’s growth. It’s not just an administrative checklist to fill vacancies. Think of it as a strategic sequence of actions from spotting a talent need to welcoming a new team member that ensures you attract, select, and keep the very best people for your mission.
Rethinking Your Hiring Process for Growth

For a Chief Human Resources Officer (CHRO), the hiring process is so much more than a series of steps; it’s a direct reflection of the company’s brand, its values, and its ambitions for the future. We have to move beyond a transactional view. Today’s most successful organisations treat talent acquisition as a core strategic advantage.
It’s a lot like building a championship-winning sports team. Every single stage matters immensely, from scouting top prospects and evaluating their skills to ensuring they fit seamlessly into the team culture. A single weak link in this chain can compromise the entire effort.
The Modern, Candidate-Centric Approach
The modern hiring process is all about the candidate’s journey. In a fiercely competitive talent market, where skilled professionals have plenty of options, the experience you provide is a powerful differentiator. This means shifting from an old-school, employer-centric model to one that is transparent, respectful, and genuinely engaging for every single applicant.
A truly effective hiring process treats every candidate like a valued customer. Even those who don’t receive an offer should walk away with a positive impression of your brand. They could become future applicants, customers, or even brand advocates.
This candidate-centric philosophy is built on a few key pillars:
- Clear Communication: Keeping applicants in the loop about their status and what to expect next reduces their anxiety and shows you respect their time.
- Data-Driven Decisions: Using metrics and analytics to spot bottlenecks, improve efficiency, and ensure fairness throughout the evaluation process.
- Strategic Sourcing: Moving beyond just posting on job boards to actively hunting for talent through multiple channels, including employee referrals and social recruiting.
- Seamless Integration: Realising that the process doesn’t end when an offer is accepted. It extends all the way through a structured and welcoming onboarding experience.
By reframing the journey through this strategic lens, CHROs can transform their hiring process from a simple operational task into a powerful engine for sustained business growth. This guide will give you a clear roadmap to optimise each stage.
Mastering the Strategic Recruitment Stages
A world-class hiring process doesn’t just happen. It’s a carefully engineered workflow, almost like a talent assembly line where every stage is fine-tuned for efficiency, fairness, and attracting the absolute best people. This kind of blueprint is what ensures you get consistent, high-quality results time after time.
The entire recruitment journey can be mapped out into clear, actionable stages. From the big-picture strategic workforce planning all the way to making that final, compelling offer, each phase has its own set of best practices you need to nail. Let’s walk through this modern hiring process step by step.
Crafting an Inclusive Job Description
The job description is your first handshake with a potential candidate, and it needs to be much more than a laundry list of duties. A well-written description is a powerful magnet, pulling in high-calibre, diverse talent while gently pushing away those who aren’t the right fit. It really sets the stage for the entire candidate experience.
To make your descriptions truly connect, focus on using inclusive language. Ditch the corporate jargon and gender-coded words that can unintentionally put off qualified people. Instead of a long list of rigid “requirements,” try framing the role around the challenges the new hire will tackle and the impact they’ll have. This way, you attract proactive problem-solvers, not just people ticking boxes on a job board.
Sourcing Talent Beyond the Job Boards
Just posting on job boards is like fishing in one, overcrowded pond while ignoring the ocean. A modern, multi-channel sourcing strategy is absolutely essential for building a healthy pipeline of talent. The idea is to meet potential candidates right where they are, whether they’re actively job hunting or not.
This infographic shows the crucial screening stage, where all your sourcing efforts come together and candidates get their first evaluation.
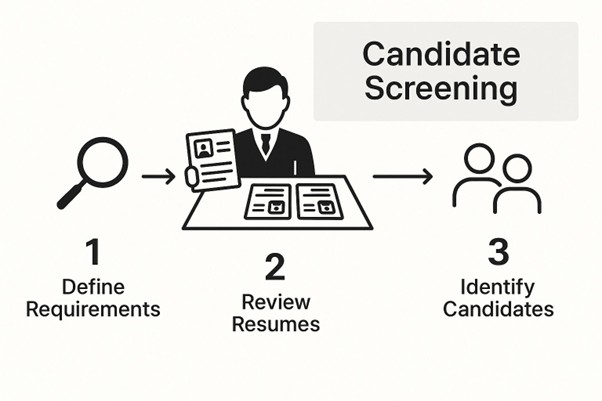
As you can see, a systematic screening process acts as the gateway to the rest of the hiring funnel, making sure only qualified people move on to the next round.
Effective sourcing is all about a smart mix of proactive tactics:
- Social Recruiting: Getting active on professional networks like LinkedIn doesn’t just help fill today’s open roles; it helps you build a talent community for tomorrow.
- Employee Referral Programmes: Often, your best source for great candidates is your current team. A solid referral programme can bring in hires who are a better culture-add and stick around longer. In fact, a huge 82% of employers say employee referrals give them the best return on investment compared to any other source.
- Direct Outreach: For those senior or super-specialised roles, reaching out directly to passive candidates is often the only way to go.
This proactive approach is critical, especially in a market that’s heating up. India’s recruitment industry, for example, is expected to see a 15-20% jump in job opportunities, mostly thanks to tech advancements. This growth means companies have to get smarter with their sourcing to find the best talent out there.
Implementing Structured Interviews
Once you’ve got a strong pool of candidates, it’s time for interviews. To keep the process fair, consistent, and legally sound, structured interview techniques are a must. This approach takes the guesswork and “gut feelings” which are often riddled with unconscious bias out of the equation.
A structured interview ensures every candidate gets the same opportunity to shine. By asking the same competency-based questions in the same order, you’re not just comparing candidates; you’re comparing their demonstrated abilities against a consistent benchmark.
This systematic approach gives you a reliable framework for spotting top performers. For a closer look at this, you might find our guide on how to hire top talent and accelerate recruitment helpful.
The Evaluation and Offer Stage
After the interviews are done, the hiring team needs to get together and evaluate each candidate against a pre-defined scorecard. This scorecard should be built around the core competencies you identified right at the start. Using this data-driven method makes sure the final decision is based on objective evidence, not just who someone liked best.
When you’ve made your choice, the final offer stage is make-or-break. A slow or clumsy offer can mean losing your top candidate to a competitor. The offer should be presented with clarity and enthusiasm, reminding them of the value of the role and the company. This is your last chance to create a positive experience, leaving a lasting impression that not only secures your new hire but also boosts your employer brand.
Leveraging Technology to Optimise Hiring

In today’s recruitment world, technology isn’t just a nice-to-have; it’s the engine that drives a competitive hiring machine. For a CHRO, choosing the right tech stack is like giving your talent acquisition team a set of superpowers. It lets them move faster, make smarter decisions, and most importantly focus on the human conversations that really matter.
This isn’t about replacing recruiters with robots. It’s about augmenting their skills, freeing them from the grind of admin work so they can spend their time building real relationships with top-tier candidates.
Automating the Pipeline with Applicant Tracking Systems
The Applicant Tracking System (ATS) is the heart of any modern recruitment operation. Think of it as the central command centre for your entire hiring process. It takes on the tedious, repetitive tasks like screening résumés, managing candidate pipelines, and scheduling interviews.
It’s a game-changer. Without this kind of automation, recruiters can easily burn up to a third of their week just sourcing candidates for one role. A solid ATS hands that time back, letting your team focus on high-value work like engaging candidates and building talent pools for the future.
The Rise of AI in Recruitment
Beyond the foundational ATS, Artificial Intelligence (AI) is adding a whole new layer of smarts to talent acquisition. AI tools aren’t a far-off dream anymore; they’re here, solving real-world hiring problems today.
These tools make a tangible difference at several key stages:
- Optimised Job Postings: AI can review your job descriptions and suggest tweaks to attract a more diverse and qualified group of applicants.
- Intelligent Sourcing: AI platforms can proactively scour the web for passive candidates who fit your ideal profile, even if they aren’t actively job hunting.
- Candidate Engagement: AI-powered chatbots can give candidates instant answers to their questions, 24/7, which dramatically improves the applicant experience and keeps top talent interested.
By taking care of the initial screening and basic engagement, AI allows your human recruiters to step into the conversation at a much more meaningful point. It cuts through the noise so your team can focus on building genuine connections with the most promising people.
Expanding Reach with Virtual Interviews
With remote and hybrid work now the norm, virtual interviews are a non-negotiable part of the process. Video interview platforms, whether live or pre-recorded, smash down geographical barriers and open up a truly global talent pool.
This shift brings huge benefits in efficiency and accessibility. A one-way video interview, where a candidate records their answers to set questions, allows hiring managers to assess far more applicants in less time than it would take to do traditional phone screens. This speeds up the front end of the process, ensuring you don’t lose great candidates to competitors who simply move faster.
For a deeper dive into creative ways to find talent, check out our guide on unique recruitment strategies to hire talent effortlessly. By strategically weaving these technologies into your process, you can build a hiring function that’s not only quicker and more cost-effective but also fairer and more candidate-friendly.
Measuring What Matters in Your Hiring Process
You can’t improve what you don’t measure. It’s an old business saying, but it’s especially true for your hiring process. For a CHRO, data is the only language that truly translates recruitment efforts into strategic business value. It’s how you shift the conversation from “we feel” to “we know,” and prove your talent team’s impact in the boardroom.
A solid set of Key Performance Indicators (KPIs) works like a diagnostic dashboard for your entire hiring engine. It shows you what’s running smoothly, where the bottlenecks are, and how your team’s performance compares to industry benchmarks. Let’s dig into the metrics that really matter.
Gauging Speed and Efficiency
In a tight talent market, speed is your secret weapon. The best candidates are often gone in just a few weeks, so a slow, clunky process will cost you top talent, guaranteed. Two key KPIs help you keep a finger on the pulse of your hiring velocity.
Time to Hire tracks the total number of days between a candidate hitting ‘apply’ and accepting their job offer. If this number starts creeping up, it’s a major red flag. It could mean anything from slow feedback loops with hiring managers to inefficient interview scheduling or just too many stages in the process.
Time to Fill, on the other hand, measures the days from the moment a job requisition is approved to when an offer is finally accepted. This metric gives you a broader view of the entire recruitment cycle, including sourcing and initial screening. A long Time to Fill can directly hit departmental productivity and even revenue.
Understanding the Financial Impact
Hiring is a major investment. Tracking its cost is fundamental to managing your budget and demonstrating a clear return on that investment. The most important metric here is as straightforward as it is powerful.
Cost per Hire is simply the total sum of all your recruitment costs (both internal and external) divided by the total number of hires you made in a given period. This isn’t just about agency fees; it includes everything from job ad spend and recruiter salaries to tech subscriptions and referral bonuses.
Tracking Cost per Hire isn’t about pinching pennies. It’s about making smarter investments. When you understand this metric, you can shift your budget towards the channels that deliver the best candidates for the lowest cost, truly optimising every rupee spent.
This data is exactly what you need to build a compelling business case for investing in better tools or programmes that will ultimately drive down long-term hiring expenses.
Evaluating Channel and Source Effectiveness
So, where do your best hires really come from? Answering this question is the key to refining your sourcing strategy and putting your energy where it counts. This is where tracking your Source of Hire becomes non-negotiable.
This KPI breaks down your new hires by the channel that brought them to you. This could be:
- Employee referrals
- Your company careers page
- Professional networking sites like LinkedIn
- External recruitment agencies
- Job boards
When you analyse this data, a clear pattern often emerges. While job boards might deliver the highest volume of applicants, you’ll frequently find that employee referrals produce the highest Quality of Hire.
A good set of KPIs is your roadmap to a more efficient and effective hiring strategy. They provide the insights needed to make informed decisions, justify investments, and align recruitment efforts with overarching business goals.
Essential Hiring Process KPIs
This table outlines key performance indicators to measure the efficiency and effectiveness of your hiring process, along with their strategic importance.
| KPI | What It Measures | Why It Matters for CHROs |
| Time to Hire | The number of days from when a candidate applies to when they accept an offer. | Indicates operational efficiency. A shorter time reduces the risk of losing top candidates to competitors. |
| Time to Fill | The number of days from when a job requisition is approved to when an offer is accepted. | Reflects the overall speed of the entire hiring lifecycle and its impact on business continuity and productivity. |
| Cost per Hire | The total recruitment cost divided by the number of hires. | Essential for budget management and demonstrating the financial ROI of the talent acquisition function. |
| Source of Hire | The percentage of hires coming from different channels (e.g., referrals, job boards, agencies). | Helps optimise spending by focusing resources on the most effective and cost-efficient sourcing channels. |
| Quality of Hire | The value a new hire adds, often measured by performance ratings, retention, and manager satisfaction. | The ultimate measure of recruitment success. It directly links hiring outcomes to long-term business performance. |
| Offer Acceptance Rate | The percentage of candidates who accept a formal job offer. | A low rate can indicate issues with compensation, benefits, company culture, or the candidate experience itself. |
By regularly tracking these metrics, CHROs can move beyond simple headcount reporting and start telling a powerful, data-backed story about how talent acquisition drives the business forward.
The Ultimate Metric: Quality of Hire
Speed and cost are important, but they’re meaningless if you aren’t bringing the right people into the organisation. Quality of Hire is arguably the most critical and the most challenging recruitment KPI you can measure. It’s all about quantifying the value a new employee brings to the table.
Because it’s not a single data point, you need to combine several post-hire indicators to get a clear picture:
- New hire performance scores (often from their first performance review)
- Manager satisfaction surveys
- New hire retention rate after 6 or 12 months
- Time to productivity (how quickly they start delivering value)
A low Quality of Hire score is a signal that something is broken. Perhaps your interview process isn’t properly assessing core competencies, or your sourcing strategy is attracting the wrong kind of candidate profile. By consistently measuring these KPIs, you turn your hiring process from a reactive function into a proactive, data-driven strategic asset.
Why Hiring Processes Need an RPO-Led Approach?
As hiring becomes more complex, many organisations are rethinking how their hiring processes are structured and executed.
Traditional in-house models often struggle with:
- fluctuating hiring volumes
- niche talent requirements
- speed and scalability challenges
This is where Recruitment Process Outsourcing (RPO) plays a critical role.
An RPO-led hiring process brings:
- access to broader talent networks
- faster hiring cycles
- data-driven decision-making
- consistent candidate experience
More importantly, it allows organisations to move from reactive hiring to a more structured, outcome-driven talent strategy.
Winning Talent with a Superior Candidate Experience
In a world where company reputations are built on Glassdoor reviews and social media chatter, every single interaction within your hiring process is a branding opportunity. A negative experience can turn a great candidate away forever, while a positive one can create a brand advocate, even if they don’t get the job.
The key is to stop thinking like a recruiter and start thinking like a customer experience manager. Every applicant is, in essence, a customer of your employer brand. They’re investing their time, energy, and hopes in your organisation. How you treat them directly shapes their perception of your company and its values. A seamless, respectful process is no longer a “nice-to-have”; it’s a powerful competitive advantage.
The Anatomy of a Positive Candidate Journey
Creating a superior experience doesn’t require a massive budget, but it does demand empathy and meticulous attention to detail. It’s about making candidates feel seen, valued, and respected at every single touchpoint.
A positive journey is built on a foundation of transparency and communication. This means providing clear timelines, acknowledging every application, and most importantly offering timely feedback. Even a polite, automated rejection email is far better than the deafening silence that 75% of candidates say they experience after applying.
The ultimate goal is to ensure that every person who interacts with your hiring process walks away with a positive impression, regardless of the outcome. This simple principle builds a stronger long-term talent pipeline and enhances your reputation as an employer of choice.
Key Pillars of an Excellent Candidate Experience
To truly transform your process, you need to zero in on the three areas that have the biggest impact on how candidates see your brand.
- A Seamless Application Process: A long, clunky application is a major turn-off. If it takes more than a few minutes or isn’t mobile-friendly, you are losing top talent before you even know they exist. Your first step should be to simplify forms and only ask for what’s essential upfront.
- Transparent and Timely Communication: Nobody likes being left in the dark. Keep candidates informed about their status and what to expect next. A simple update can reduce anxiety and shows you respect their time and effort.
- Respectful and Prepared Interviews: Ensure your interviewers are trained, punctual, and have actually read the candidate’s résumé. The interview should feel like a two-way conversation, giving candidates a real chance to assess if your company is the right fit for them.
Focusing on these elements not only attracts better talent but also directly impacts your employer brand. For more insights on this, you can learn more about the best practices for assessing and hiring a culture fit candidate.
The Growing Importance of Flexibility and Empathy
The expectations of the modern workforce are changing fast. It’s not just about the job anymore; it’s about how that job fits into their life. Workplace flexibility, once a perk, is now a decisive factor for many.
In fact, it is expected that 34% of jobs in India will offer flexible arrangements, making it a critical competitive advantage. This trend points to a broader shift towards more human-centric employer branding, where empathy and understanding are just as important as the pay cheque. By treating your candidates with the same care you would a valued customer, you don’t just fill a role, you build a reputation that attracts the best people organically.
Wrapping Up
The hiring process is no longer just a series of steps. It is a strategic function that directly influences business performance. As talent markets become more competitive and roles more complex, organisations need to move beyond traditional hiring models. A structured, insight-led hiring process that combines strategy, speed, and scalability is what enables long-term success.
FAQs
What is a modern hiring process?
A modern hiring process focuses on speed, candidate experience, and alignment with business goals, using structured workflows and data-driven decision-making.
Why is the hiring process important for business growth?
An efficient hiring process ensures access to the right talent at the right time, directly impacting productivity, innovation, and overall business performance.
What are the biggest challenges in the hiring process today?
Common challenges include talent shortages, long hiring cycles, candidate drop-offs, and misalignment between role requirements and available skills.
How can companies improve hiring efficiency?
Improving hiring efficiency requires better workforce planning, streamlined interview processes, use of technology, and strong talent pipelines.
How does RPO improve the hiring process?
RPO enhances hiring by providing scalability, access to specialised talent, improved speed, and a more structured, outcome-focused recruitment approach.
Organisations that rethink their hiring process today are better positioned to build stronger, more resilient teams.
Taggd partners with enterprises to design and execute hiring processes that combine deep market insights, AI-led intelligence, and scalable RPO solutions to deliver consistent hiring outcomes.