
GCC salaries in India are projected to rise 10.4% in 2026, up from 9.9% in 2025. GCC roles also command a ~20% salary premium over equivalent non-GCC roles, reflecting the growing demand for specialized talent.
But the bigger GCC salary trend for 2026 is not simply higher pay. Compensation is becoming more differentiated by skill, experience, role complexity, and location. AI/ML and specialized R&D roles command higher premiums, while the salary gap between Tier-1 and Tier-2 locations is beginning to narrow.
Based on Taggd’s GCC Talent Lab Report 2026, this article breaks down GCC salary benchmarks across R&D, technology and engineering, F&A, and shared services to help CHROs and TA leaders plan compensation more effectively.
GCC Salary Trends in India 2026: At a Glance
GCC salary trends in India 2026 show continued pay growth, a widening premium for specialised skills, and narrowing salary gaps between Tier-1 and Tier-2 locations.
| GCC salary trend | 2026 benchmark |
| Average GCC salary increment | 10.4% |
| GCC salary premium vs equivalent non-GCC roles | 20% |
| Tier-1 entry-level salary | INR 6-12 LPA |
| Tier-2 entry-level salary | INR 5-9 LPA |
| Tier-1 senior-level salary | INR 45-90 LPA |
| Tier-2 senior-level salary | INR 30-60 LPA |
| Tier-2 entry salary movement | INR 5-9 LPA → INR 7-12 LPA |
| AI/ML compensation premium | ~1.7× standard tech premium |
| Junior AI/ML salary growth | 40-50% YoY |
Key takeaway: GCC compensation in 2026 is increasingly determined by skill scarcity, experience, role complexity, and location rather than a single GCC-wide salary benchmark.
Source: Taggd GCC Talent Lab Report 2026. Salary ranges are indicative and may vary by role, organization, location, capability depth, and experience.
GCC Salary Bands by Career Stage
As per Taggd’s GCC Report 2026, GCC salary bands in 2026 vary significantly by experience and city tier.
Entry-level professionals can expect INR 6-12 LPA in Tier-1 cities and INR 5-9 LPA in Tier-2 locations.
Mid-career roles typically range from INR 18-35 LPA in Tier-1 and INR 12-25 LPA in Tier-2.
At the senior level, compensation can reach INR 45-90 LPA in Tier-1 hubs and INR 30-60 LPA in Tier-2 cities.
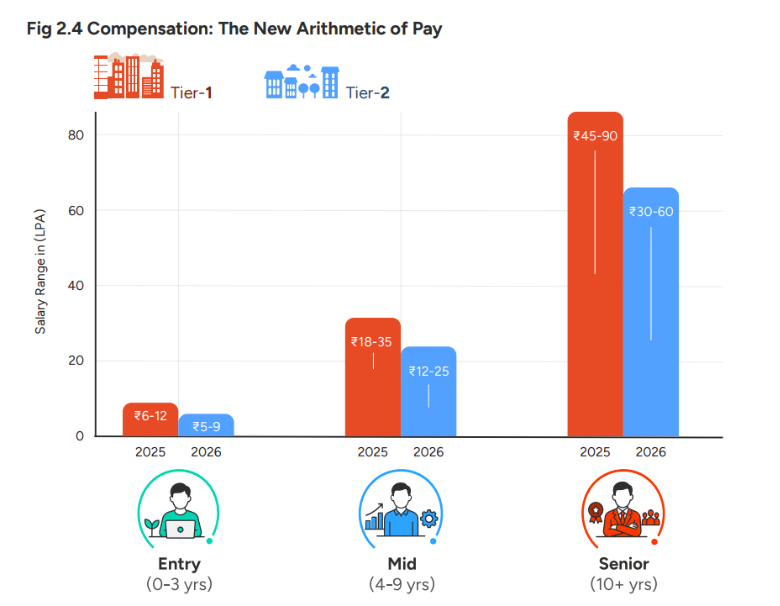
These ranges are indicative and may vary based on roles, organization, specialized skills, location, and experience.
Tier-1 entry-level pay climbed 25-33% in a single year, with the senior band crossing the INR 50 LPA floor in metros, up from INR 40 LPA the year before.
Tier-2 entry pay moved from INR 5-9 LPA to INR 7-12 LPA in the same window, a percentage jump that matches or exceeds Tier-1 growth, even though absolute Tier-2 pay stays 25-40% lower.
Salary Benchmarks by Domain
The headline salary ranges hide an important distinction: GCC compensation varies significantly by the type of work being hired for. AI-led R&D sits at one end of the spectrum, while traditional support functions follow a different compensation curve.
R&D
| Role | 1-3 yrs | 5-10 yrs | 10-15 yrs | 15+ yrs |
| Generative AI / MLOps R&D | INR 12-25L | INR 35-55L | INR 55-80L | INR 90-150L+ |
| AI/ML R&D | INR 18-30L | INR 50-75L | INR 65-100L | INR 100-180L+ |
| Prompt Engineer / AI Governance | INR 10-18L | INR 30-45L | INR 45-65L | INR 70-120L |
| Semiconductor Design R&D | INR 9-14L | INR 22-38L | INR 42-65L | INR 65-125L |
| ER&D Deep Tech (e.g., Zero-Trust Architect) | INR 8-15L | INR 25-40L | INR 40-60L | INR 60-100L |
| Validation / Automation Engineer | INR 8-12L | INR 15-25L | INR 30-50L | INR 55-90L |
| Regulatory Compliance Specialist | INR 7-12L | INR 12-20L | INR 20-35L | INR 40-60L |
| Molecular Biologist / R&D Scientist | INR 8-15L | INR 15-30L | INR 30-55L | INR 55-120L |
| EV Battery / Powertrain R&D | INR 8-14L | INR 20-35L | INR 35-55L | INR 55-100L |
| ADAS / Autonomous Systems Engineer | INR 10-15L | INR 25-40L | INR 40-60L | INR 60-100L+ |
| Sensor Fusion / LiDAR Engineer | INR 10-14L | INR 18-30L | INR 30-50L | INR 50-90L |
Source: Taggd GCC Talent Lab Report 2026. Salary ranges represent indicative compensation bands and may vary by role, organization, location, capability depth, and experience.
What stands out: AI/ML R&D reaches INR 100-180L+ at 15+ years, giving it the highest salary ceiling among the roles covered in this report.
Technology & Engineering
| Role | 1-3 yrs | 5-10 yrs | 10-15 yrs | 15+ yrs |
| AI/ML / Data Engineering | INR 15-30L | INR 60-85L | INR 68-110L | INR 112-170L |
| SRE (Site Reliability Engineer) | INR 15-28L | INR 28-45L | INR 60-80L | INR 90-120L |
| Full Stack (MERN/Java) | INR 14-22L | INR 26-48L | INR 45-70L | INR 90-120L |
| Software Dev, Front End and Back End | INR 14-22L | INR 26-48L | INR 45-70L | INR 90-112L |
| App Dev / Cloud / Cyber | INR 15-24L | INR 28-35L | INR 45-60L | INR 60-85L |
| Data Analytics | INR 10-18L | INR 35-58L | INR 50-80L | INR 85-135L |
| DevOps | INR 12-20L | INR 32-50L | INR 45-68L | INR 68-100L |
| Product and Design Architecture | INR 10-15L | INR 30-45L | INR 45-65L | INR 65-100L |
| QA | INR 10-20L | INR 38-58L | INR 45-68L | INR 68-112L |
| IT Ops / PMO / Infra | INR 10-16L | INR 30-55L | INR 38-62L | INR 82-135L |
Source: Taggd GCC Talent Lab Report 2026. Salary ranges represent indicative compensation bands and may vary by role, organization, location, capability depth, and experience.
What stands out: AI/ML and Data Engineering pull ahead of other technology roles by mid-career. A 5-10 year AI/ML professional already sits above the salary range shown for several 10-15 year technology roles, including QA and IT Operations.
Shared services
| Role | 1-3 yrs | 5-10 yrs | 10-15 yrs | 15+ yrs |
| Digital Risk, Audit & Compliance | INR 9-13L | INR 27-38L | INR 38-66L | INR 65-132L |
| Process Excellence / Transitions | INR 7-11L | INR 16-28L | INR 33-38L | INR 88-176L |
| Business Analyst / Change Mgmt | INR 9-13L | INR 22-38L | INR 49-72L | INR 72-99L |
| Strategy / Business Operations | INR 11-17L | INR 33-44L | INR 44-66L | INR 66-132L |
| Legal & Compliance | INR 9-13L | INR 27-38L | INR 38-61L | INR 66-110L |
| Operations Middle/Back Office | INR 8-11L | INR 22-33L | INR 49-77L | INR 72-99L |
| Pre-Sales / Inside Sales | INR 10-15L | INR 16-33L | INR 40-55L | INR 55-88L |
| Digital Marketing / Marketing Ops | INR 7-13L | INR 22-38L | INR 33-66L | INR 55-110L |
| Corp Comm / Internal Comm / CSR | INR 7-11L | INR 16-28L | INR 28-50L | INR 44-88L |
| HR Operations & Shared Services | INR 9-13L | INR 38-55L | INR 49-83L | INR 77-132L |
| Leadership Roles | – | INR 49-61L | INR 61-88L | INR 99-176L |
Source: Taggd GCC Talent Lab Report 2026. Salary ranges represent indicative compensation bands and may vary by role, organization, location, capability depth, and experience.
What stands out: Process Excellence / Transitions has one of the widest salary spreads in the report, moving from INR 7-11L at entry to INR 88-176L at 15+ years. The range suggests that senior roles in the function can carry significantly broader, transformation-oriented responsibilities than entry-level roles.
F&A
| Role | 1-3 yrs | 5-10 yrs | 10-15 yrs | 15+ yrs |
| Finance Ops | INR 8-12L | INR 14-20L | INR 30-40L | INR 108-132L |
| FP&A / MIS | INR 10-15L | INR 23-30L | INR 32-38L | INR 108-142L |
| Tax / Treasury & Regulatory | INR 9-13L | INR 27-38L | INR 49-66L | INR 70-99L |
| Product Control (BFSI Finance Ops) | INR 8-12L | INR 25-35L | INR 45-60L | INR 65-90L |
Source: Taggd GCC Talent Lab Report 2026. Salary ranges represent indicative compensation bands and may vary by role, organisation, location, capability depth, and experience.
What stands out: F&A shows a relatively flatter salary curve through mid-career, followed by a sharper increase at senior levels. FP&A/MIS, for example, moves from a INR 10-15L entry band to INR 108-142L at 15+ years.
The AI/ML premium
Two numbers explain most of the AI/ML pay story:
- AI/ML compensation runs at roughly 1.7x the standard tech premium.
- Junior AI/ML salaries are inflating 40-50% year-on-year, one of the sharpest single-year moves in the report.
The implication for compensation planning is straightforward: AI/ML salary bands need more frequent review than traditional technology bands. A compensation framework built a year ago may no longer reflect the market for scarce AI talent.
The Tier-2 Compression Story
Tier-2 entry-level salaries have moved from INR 5-9 LPA to INR 7-12 LPA, a percentage jump that matches or exceeds Tier-1 growth, even though absolute pay in Tier-2 remains 25-40% lower.
Compensation is also following the GCC footprint into locations such as Ahmedabad, Kochi, and Jaipur.
For GCCs, this raises a planning question worth asking every cycle: how long can Tier-2 locations hold their cost advantage as more employers compete for the same pool of talent?
If your Tier-2 hiring plan assumes a fixed 30-40% discount against Tier-1, that assumption needs a yearly recheck rather than a one-time baseline.
What this means for compensation planning
- Budget by domain, not just by city. F&A, technology/engineering, and AI/ML can move at very different speeds even within the same location.
- Treat AI/ML pay as a moving target. A 40-50% YoY increase at junior levels makes annual compensation reviews particularly important for these roles.
- Recheck Tier-2 discounts annually. The salary gap is narrowing, particularly at entry level.
- Watch late-career jumps in traditional functions. F&A and Process Excellence show senior compensation bands that are significantly higher than their entry-level ranges suggest.
- Build compensation around capability scarcity. Location remains important, but the premium increasingly follows specialized skills rather than geography alone.
Wrapping Up
GCC compensation in 2026 is no longer simply a question of Tier-1 versus Tier-2.
The bigger question is what capability are you paying for?
AI/ML and specialised R&D talent command a different premium. Mid-career technology talent is pulling ahead faster. Tier-2 salary gaps are narrowing. And senior roles in functions traditionally viewed as lower-cost can command substantial compensation when their scope expands.
For CHROs and TA leaders planning FY27 budgets, the message is clear:
Don’t build next year’s compensation strategy around last year’s city benchmarks. Build it around where capability is becoming scarce.
FAQs
What are the GCC salary and compensation trends in India?
As per Taggd’s GCC Report 2026, GCC salary trends in India 2026 shows continued pay growth, a widening premium for specialized skills, narraowing salary gaps between Tier-1 and Tier-2 cities.
What is the average GCC salary increment for 2026?
GCC salaries are projected to increase by 10.4% in 2026, up from 9.9% in 2025, according to Taggd’s GCC Talent Lab Report 2026.
How much more do GCCs pay compared to non-GCC roles?
GCC salaries run about 20% higher than equivalent non-GCC roles, indicating a clear compensation premium for GCC talent.
What’s the salary gap between Tier-1 and Tier-2 GCC hubs?
At entry level, Tier-1 pay ranges from INR 6-12 LPA, compared with INR 5-9 LPA in Tier-2. At senior level, Tier-1 reaches INR 45-90 LPA compared with INR 30-60 LPA in Tier-2. However, Tier-2 entry-level salaries have grown rapidly and now sit closer to Tier-1 benchmarks than before.
How much of a premium does AI/ML talent command?
AI/ML compensation runs at roughly 1.7x the standard tech premium, while junior AI/ML salaries are inflating by 40-50% year-on-year.
Is compensation planning the same across all GCC functions?
No. F&A/shared services, technology/engineering, and AI/ML/R&D follow different compensation curves. AI/ML commands the strongest premiums, while traditional functions tend to show flatter salary progression through mid-career and sharper increases at senior levels.
Which GCC role has the widest salary range in India?
Process Excellence / Transitions shows one of the widest salary ranges in the report, spanning INR 7-11L at entry to INR 88-176L at 15+ years. The spread highlights the significant difference between entry-level execution roles and senior transformation-oriented positions.
Want the complete GCC talent picture?
Download the GCC Talent Lab Report 2026 for the full salary benchmarks, city-wise talent scarcity data, hiring outlook, and FY27 workforce insights.